Scenario for developing a stormwater treatment train for a retrofit site
Stormwater treatment trains combine multiple stormwater treatment processes and/or practices in a manner that ensures management of all pollutants that could affect a receiving water. To provide guidance for stormwater managers, hypothetical treatment trains were developed for five common stormwater management scenarios. This page provides information on implementing a stormwater Best Management Practice (BMP) treatment train for a retrofit site. To see other scenarios, see related articles at the bottom of this page.
Contents
- 1 Step 1: Review project goals and site conditions
- 2 Step 2: Review pollutant removal processes and identify potential practices
- 3 Step 3: Determine site constraints and BMP placement
- 4 Step 4: Select individual BMPs and evaluate range of performance
- 5 Step 5: Size BMPs and assess performance
- 6 Step 6: Review Construction & Operations Criteria
- 7 Related articles
Step 1: Review project goals and site conditions
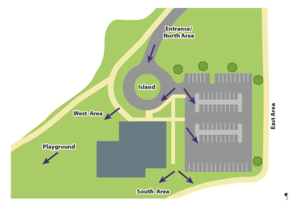
The retrofit scenario consists of a public recreation area owned by the local parks department. The site drains to a highly impaired stream that is near the westerly edge of the recreation area. The parks department is interested in creating green infrastructure that has the dual purpose of improving the quality of the stormwater discharge as well as create a demonstration project for public education. Since this is a retrofit that does not create 1 or more acre of new impervious surface, the site is not required to meet the performance requirements of the Construction Stormwater Permit. It has been agreed that a reasonable project goal would be to reduce 50 percent of the runoff volume, Total Suspended Solids (TSS), and nutrients as compared to current discharges resulting from a Water Quality Event. The site conditions are summarized in the following table and the existing site layout can be seen in the schematic to the right.
| Site | Recreation area with public building, parking areas, playgrounds, pathways, landscaped areas, and (planned) public garden |
|---|---|
| Drainage area | 3.4 acres |
| Impervious area | 47% |
| Soil conditions | Hydrologic Soil Group ‘C’, fine sandy loam with low infiltration rates. Permeability ranges between 0.2 and 0.6 inches per hour at a depth of 3 feet. Bedrock was not observed in borings conducted on site. |
| Topography and drainage | There is an elevation drop of 10 feet from the northern to the southern boundary of the site, approximately 700 feet in length, with an overall slope of 7%. The portion of the site containing the impervious surfaces and proposed BMPs is relatively flat at approximately 1.5%. |
| Project goals | Public education, rate control, runoff volume reduction of 50%, TSS reduction of 50%, nutrient reduction of 50%. |
Step 2: Review pollutant removal processes and identify potential practices
Because the goals of the project are to both decrease runoff volume and pollutant loading, the BMPs selected for this site should offer both pollutant removal and volume reduction processes. The table below summarizes the BMP practice categories and their applicability to this site
Public education and source controls are the non-structural BMP practices selected for this site. Swales and strips, infiltrators, filters, and reuse are determined to be the best structural practices to address the goals of the project for this retrofit scenario. The process of selecting and placing BMPs on a site is typically iterative, working between the site constraints, project goals, and available budget. The approach and considerations for this scenario are discussed in the following sections.
| Practice | Applicability | Reason |
|---|---|---|
| Pollution prevention and public education | X | Public education is a project goal. |
| Source controls | X | The sources of pollutants include vegetation debris, litter, and build-up of contaminants from vehicular traffic. Sweeping, vegetation management and litter management are appropriate source controls |
| Infiltrators | X | Infiltration is possible in the poor-draining soils of the site |
| Swales and strips | X | Swales and strips may serve as a good form of pretreatment and conveyance to BMPs downstream in the treatment train. |
| Filters | X | Filter BMPs should have underdrains to control any runoff that cannot be managed by the poor-draining soils. |
| Constructed basins | Too large considering the limited space available | |
| Manufactured devices [1], [2] | Underground systems will not meet the education goal of the project and are not considered. | |
| Storage, harvesting and reuse | X | Stormwater storage for re-use will provide water to irrigate existing and planned landscape areas. |
Step 3: Determine site constraints and BMP placement
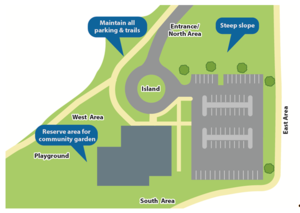
Existing site conditions cause several constraints regarding placement of BMPs. The most significant of these constraints are available space, existing topography, and regulatory requirements.
- Available space – The BMPs must fit into the existing green spaces and pavement areas of the site. BMP selection cannot result in a loss of parking, play areas, or pathways.
- Topography- Currently runoff generally drains from north to south, with the impervious surfaces existing within the southerly 1/3 of the site. The main roadway and parking areas drain to the west while the eastern parking area drains to the southeast. The building drains to the grassed area on the north and south faces of the structure. The building downspouts are connected to an underground system, but there is no record noting where the underground system discharges.
- Regulatory requirements- There are no specific regulatory requirements that must be met. The design criteria and recommendations from the Minnesota Stormwater Manual will be followed.
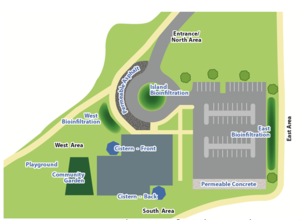
Viable locations for filter BMP placement include all landscape and grass areas adjacent to the parking lot and greenspace south of the building. Limited budget prevents reconstruction of the entire parking lot with permeable pavement; therefore only the parking stalls are considered for replacement. Cisterns for reuse would be located near the building downspouts, away from building doorways and maintenance areas. The schematic at the right identifies the specific areas considered for BMPs.
Step 4: Select individual BMPs and evaluate range of performance
As discussed in Step 2, the structural practices that are most applicable to this site for pollutant removal are swales and strips, infiltrators, filters (including biofiltration and permeable pavements with underdrains), and re-use. Cisterns to harvest runoff for reuse are being considered because the site has a volume reduction goal but the soils are too restrictive for infiltration BMPs alone.
- Public education and source controls - While public education does not have measurable performance benefits, it provides the community with an understanding of the impacts of stormwater pollution and the efforts that can be taken to mitigate those impacts. It also offers education on the function of BMPs within a watershed and the benefits they provide. By controlling the source of runoff, the volume of pollutants in stormwater runoff is reduced, and the longevity of the downstream BMPs is increased. Pollutant load reductions from source control BMPs are typically difficult to quantify.
- Filter: Permeable pavement with underdrain - Replacing a portion of the parking lot with permeable pavement allows for a reduction of pollutants through filtration. For permeable pavement designs with underdrains, pollutant removal for runoff intercepted by the underdrain is 45 percent for total phosphorus (TP) and 74 percent for TSS.
- Infiltrator: Bioinfiltration - For the volume of runoff intercepted by the bioinfiltration system pollutant removal is 100 percent for phosphorus and TSS. Water bypassing the BMP receives no treatment. For water captured by an underdrain, pollutant removal is 85 percent for TSS and 53 percent to 71 percent for phosphorus, assuming the media does not leach phosphorus.
- Swales and Strips: Grass strip - Bioinfiltration is enhanced with the installation of a pretreatment device to prevent gross pollutants and heavier solids from damaging the vegetation and clogging the filter media. Using a swale could serve as pretreatment and offer some pollutant removal benefit. However there is insufficient space and grade between the point that runoff leaves the pavement and the location of the biofiltration devices to create an effective swale. For this reason, a simple grass strip between the parking lot pavement and the biofiltration device(s) is sufficient.
- Reuse: Cistern to harvest rooftop runoff - Water that is harvested and collected in a cistern could be reused onsite for irrigation or other purposes. At this site, the collected runoff is being considered for reuse for a proposed community garden. The volume of runoff collected by the cistern will equate to 100 percent removal of the runoff volume and rooftop pollutants. Additional treatment of the runoff collected in the cistern that may be required to bring the water to a quality necessary for garden irrigation is not considered in this analysis.
While many types of BMPs could work for this site, it is determined that permeable pavement with underdrains, grass strips, bioinfiltration and harvesting will best meet the goals of the project, while working within site constraints and meeting client budget expectations. The BMP sizing is restricted to the available space, which for some of the BMPs is not sufficient to contain the full volume of a Water Quality Event. Because of this, undersized BMPs are routed to downstream BMPs to create the treatment trains. The schematic at the right displays the proposed BMP locations.
Step 5: Size BMPs and assess performance
BMP sizing can also be an iterative process between meeting project goals, working within site constraints, meeting regulatory requirements, and meeting client expectations. The MIDS calculator was used to evaluate the performance goals for the site given the drainage area, soil conditions, impervious area, average annual rainfall for the area, and the retention goal (1.1 inches). Assumptions included an annual phosphorus event mean concentration (EMC) of 0.3 milligrams per liter and an annual TSS EMC of 54.5 milligrams per liter. The following table summarizes the existing site runoff, volume and pollutant retention goals.
The initial siting of BMPs was made to utilize as much of the site as available, given the constraints of maintaining parking, building access, pathways, playground and (proposed) community garden. The BMPs were sized to maximize the project performance goals within the available space on site. Using the MIDS calculator, maximizing the location and sizing of the BMPs achieved a 90 percent reduction in runoff volume and an 82 percent reduction in both TSS and TP. A second round of BMP siting was conducted to accommodate a limited budget while still meeting the 50 percent reduction performance goals for the project. Two bioretention cells that managed the runoff from primarily pervious surfaces were deleted from the project, the area of porous asphalt was reduced by half, and the sizes of the cisterns was reduced from 5000 gallons to 2500 gallons, each. The following summarizes the performance of the revised design.
| performance goal percentages | Annual runoff volume (acre-feet | Annual particulate phosphorus load (lbs) | Annual dissolved phosphorus load (lbs) | Annual total suspended solids load (lbs) | Performance goal volume retention requirement (ft3 |
|---|---|---|---|---|---|
| 100% | 4.57 | 2.05 | 1.68 | 677 | 6389 |
| 50% | 2.29 | 1.03 | 0.84 | 339 | 3195 |
Permeable pavement
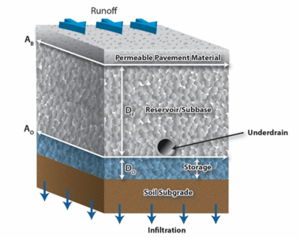
The Parks Department has requested that two different types of permeable pavements be installed in order to determine if there are any significant maintenance differences and to demonstrate to the community the options available. Two areas have been designated for permeable pavements, as shown on the schematic. The pavement in the westerly section of the parking lot will be replaced with permeable asphalt. The pavement in the easterly parking area will be replaced with pervious concrete. An underdrain will be installed in both areas since the soils below the pre-existing parking area are more compact than the surrounding soils. The schematic on the right shows the typical cross-section of both types of permeable pavements.
The permeable pavement sizing is controlled by several design criteria. The area of parking available for the pervious pavement is 0.12 acres, with runoff from an additional 0.26 acres of impervious surfaces and 0.12 acres from pervious surfaces. Both parking areas will receive overflow runoff from upstream BMPs (cisterns). The amount of at-grade contributing impervious drainage area into permeable pavement should not exceed a 5:1 ratio to help reduce the rate of sedimentation. This pavement meets the criteria, with a final ratio of approximately 3:1, including the area contributed from the cistern. The other adjustable variable for this BMP is depth of aggregate reservoir and the vertical location of the underdrain within the reservoir. These variables are controlled by the BMP’s capacity to infiltrate the treatment volume within 48 hours. The table below displays the sizing parameters used for the permeable pavement design. For guidance on using the MIDS calculator for permeable pavement, link here.
| Permeable Pavement Design | Permeable Pavement Surface Area (ft2) | Surface Area at Subgrade (ft2) | Storage Depth (ft.) | Storage Media Porosity | Drawdown Time (hrs.) |
|---|---|---|---|---|---|
| Permeable Asphalt | 1900 | 1900 | 1 | 0.42 | 48 |
| Permeable Concrete | 1900 | 1900 | 0.8 | 0.42 | 48 |
The infiltration rate of the underlying soils is 0.2 inches per hour. These parameters were entered into the MIDS calculator to evaluate performance of the permeable pavement BMPs for runoff volume and pollutant load reductions. The results are summarized in the table below.
| Parameter | Permeable asphalt | Permeable concrete |
|---|---|---|
| Runoff Volume from Direct Watershed (ft3) | 759 | 759 |
| Runoff Volume from Upstream BMPs (ft3) | 0 | 265 |
| Retention Volume Provided by BMP (ft3) | 759 | 638 |
| Outflow Volume from BMP (ft3) | 0 | 386 |
| Percent Performance Goal Achieved (%) | 100 | 62 |
| Pollutant | Parameter | Permeable asphalt | Permeable concrete |
|---|---|---|---|
| Volume | Runoff from Direct Watershed (acre-ft.) | 0.48 | 0.45 |
| Runoff from Upstream BMPs (acre-ft.) | 0.03 | 0.19 | |
| Retention Volume Provided by BMP (acre-ft.) | 0.47 | 0.50 | |
| Outflow Volume from BMP (acre-ft.) | 0.40 | 0.14 | |
| Percent Performance Goal Achieved (%) | 91 | 78 | |
| Particulate phosphorus | Particulate P from Watershed (lbs.) | 0.21 | 0.20 |
| Particulate P from Upstream BMPs (lbs.) | 0.02 | 0.08 | |
| Particulate P Load Reduction (lbs.) | 0.23 | 0.27 | |
| Particulate P Outflow | 0.00 | 0.01 | |
| Total Percent Particulate P Reduction | 98 | 96 | |
| Dissolved phosphorus | Dissolved P from Watershed (lbs.) | 0.18 | 0.16 |
| Dissolved P from Upstream BMPs (lbs.) | 0.01 | 0.07 | |
| Dissolved P Load Reduction (lbs.) | 0.17 | 0.18 | |
| Dissolved P Outflow | 0.02 | 0.05 | |
| Total Percent Dissolved P Reduction (%) | 92 | 78 | |
| Total suspended solids (TSS) | TSS from Watershed (lbs.) | 71 | 66 |
| TSS from Upstream BMPs (lbs.) | 5 | 28 | |
| TSS Load Reduction (lbs.) | 74 | 89 | |
| TSS Outflow | 2 | 5 | |
| Total Percent TSS Reduction (%) | 97 | 95 |
Bioinfiltration basins
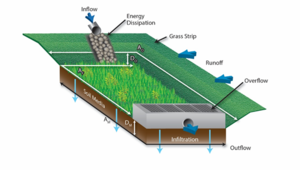
The three bioinfiltration basins are located in areas that are able to capture a maximum amount of runoff from impervious sources. The primary goal when sizing these bioinfiltration basins is to manage the maximum volume of direct runoff in the space available, plus additional excess runoff not managed by upstream treatment train BMPs. The schematic on the left shows the location of these basins. The schematic on the right shows a typical configuration and components of a bioinfiltration basin.
The inflow to each bioinfiltration basin will be directed across the grass channels surrounding each basin, serving as pre-treatment. Each basin itself will rely on infiltration into existing soils in the ponding area of the BMP within the required 48 hour drawdown time. Excess flow from the Island Bioinfiltration Basin will overflow to the permeable asphalt BMP located east of the basin. The West Bioinfiltration Basin will receive runoff from the permeable asphalt BMP. The East Bioinfiltration Basin receives runoff from the permeable concrete pavement. Runoff from storm events larger than the Water Quality Event will be directed to an overflow lined with rock and released at non-erosive rates. Compost Mix C will be used as the soil media in all the basins. No additional sand layer for enhanced phosphorus removal is included for this site.
The major constraints for sizing the basins include the basin area, and the depth of the ponding area. All basin sizes are controlled by a required 10 foot setback from the property line and/or from the recreation building, as well as a desired offset from the parking lot to infiltration towards non-permeable pavement foundations to avoid frost heave concerns, per MPCA design criteria. This additionally provides pretreatment of any direct runoff not routed through the upstream BMPs, allowing for impervious surface disconnection over a grass strip between the parking lot and the bioinfiltration basin. The table below displays the sizing input parameters for the three bioinfiltration basins.
| Bioinfiltration basin | Surface area at overflow (ft2) | Media surface area (ft2) | Overflow (ft.) | Crawdown time (hrs) |
|---|---|---|---|---|
| Island bioinfiltration basin | 1200 | 1100 | 0.8 | 48 |
| West bioinfiltration basin | 1200 | 1100 | 0.8 | 48 |
| East bioinfiltration basin | 1000 | 950 | 0.8 | 48 |
The infiltration rate of the underlying soils is 0.2 to 0.3 inches per hour. These parameters were entered into the MIDS calculator to evaluate the performance of the BMP. The results are summarized in the table below.
| Parameter | Island bioinfiltration basin | West bioinfiltration basin | East bioinfiltration basin |
|---|---|---|---|
| Runoff Volume from Direct Watershed (ft3) | 918 | 1038 | 1038 |
| Runoff Volume from Upstream BMPs (ft3) | 0 | 0 | 386 |
| Retention Volume Provided by BMP (ft3) | 918 | 920 | 780 |
| Outflow Volume from BMP (ft3) | 0 | 118 | 644 |
| Percent Performance Goal Achieved (%) | 100 | 89 | 55 |
| Pollutant | Parameter | Island bioinfiltration basin | West bioinfiltration basin | East bioinfiltration basin |
|---|---|---|---|---|
| Volume | Runoff from Direct Watershed (acre-ft.) | 0.53 | 0.88 | 0.60 |
| Runoff from Upstream BMPs (acre-ft.) | 0.00 | 0.04 | 0.14 | |
| Retention Volume Provided by BMP (acre-ft.) | 0.49 | 0.72 | 0.59 | |
| Outflow Volume from BMP (acre-ft.) | 0.03 | 0.21 | 0.15 | |
| Percent Performance Goal Achieved (%) | 93 | 78 | 80 | |
| Particulate phosphorus | Particulate P from Watershed (lbs.) | 0.24 | 0.40 | 0.27 |
| Particulate P from Upstream BMPs (lbs.) | 0.0 | 0.0 | 0.01 | |
| Particulate P Load Reduction (lbs.) | 0.22 | 0.31 | 0.22 | |
| Particulate P Outflow | 0.02 | 0.09 | 0.06 | |
| Total Percent Particulate P Reduction | 93 | 78 | 80 | |
| Dissolved phosphorus | Dissolved P from Watershed (lbs.) | 0.19 | 0.32 | 0.22 |
| Dissolved P from Upstream BMPs (lbs.) | 0.00 | 0.02 | 0.05 | |
| Dissolved P Load Reduction (lbs.) | 0.18 | 0.26 | 0.22 | |
| Dissolved P Outflow | 0.01 | 0.08 | 0.05 | |
| Total Percent Dissolved P Reduction (%) | 94 | 77 | 80 | |
| Total suspended solids (TSS) | TSS from Watershed (lbs.) | 78 | 131 | 89 |
| TSS from Upstream BMPs (lbs.) | 0 | 2 | 5 | |
| TSS Load Reduction (lbs.) | 73 | 103 | 75 | |
| TSS Outflow | 5 | 30 | 19 | |
| Total Percent TSS Reduction (%) | 94 | 77 | 80 |
Cisterns
The Parks Department requested that the BMPs include cisterns for the storage of rooftop runoff for the purpose of irrigation for grassed surfaces as well as for the planned community garden. The initial assessment of the rooftop size determined that two 5,000 gallon cisterns will capture the runoff from a Water Quality Event. However budget limitations limited the installation to two 2,500 gallon cisterns. The cistern installed on the front of the building is adjacent to the porous concrete parking stalls. It was determined that this parking area could accommodate overflow from the front cistern. The rear cistern is near the East Bioretention Basin, however the elevation difference between the cistern and the basin would not accommodate the overflow. Therefore it was determined that the rear cistern could overflow across a rock channel to a low area on the site which will not damage any nearby structures. The table below displays the sizing input parameters for both cisterns.
| Cistern | Reuse storage volume (ft3) | Irrigation application area (ac) | Irrigation application rate (in/week) | Irrigation season |
|---|---|---|---|---|
| Front | 334 | 1.5 | 2.5 | April-October |
| Rear | 333 | 1.5 | 2.5 | April-October |
The performance of these cisterns is represented by the volume of runoff that is reused, or directed to other purposes, and not discharged to surface waters. Because each cistern is sized the same, performance for each is identical. The total combined performance is summarized in the table below.
| Parameter | Value |
|---|---|
| Runoff Volume from Direct Watershed (ft3) | 1198 |
| Runoff Volume from Upstream BMPs (ft3) | 0 |
| Retention Volume Provided by BMP (ft3) | 668 |
| Outflow Volume from BMP (ft3) | 530 |
| Percent Performance Goal Achieved (%) | 56 |
| Pollutant | Parameter | Value |
|---|---|---|
| Volume | Runoff from Direct Watershed (acre-ft.) | 0.68 |
| Runoff from Upstream BMPs (acre-ft.) | 0.00 | |
| Retention Volume Provided by BMP (acre-ft.) | 0.30 | |
| Outflow Volume from BMP (acre-ft.) | 0.37 | |
| Percent Performance Goal Achieved (%) | 45 | |
| Particulate phosphorus | Particulate P from Watershed (lbs.) | 0.31 |
| Particulate P from Upstream BMPs (lbs.) | 0.00 | |
| Particulate P Load Reduction (lbs.) | 0.14 | |
| Particulate P Outflow | 0.17 | |
| Total Percent Particulate P Reduction | 45 | |
| Dissolved phosphorus | Dissolved P from Watershed (lbs.) | 0.24 |
| Dissolved P from Upstream BMPs (lbs.) | 0 | |
| Dissolved P Load Reduction (lbs.) | 0.11 | |
| Dissolved P Outflow | 0.13 | |
| Total Percent Dissolved P Reduction (%) | 45 | |
| Total suspended solids (TSS) | TSS from Watershed (lbs.) | 100 |
| TSS from Upstream BMPs (lbs.) | 0 | |
| TSS Load Reduction (lbs.) | 44 | |
| TSS Outflow | 56 | |
| Total Percent TSS Reduction (%) | 44 |
Overall retrofit BMP treatment train performance
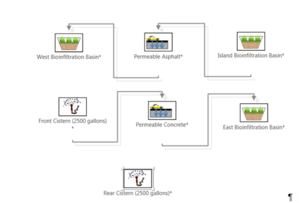
The treatment train as a whole was evaluated using the MIDS calculator. The Island Bioinfiltration Basin excess flow is routed to the permeable asphalt pavement. The permeable asphalt underdrain discharges to the downstream West Bioinfiltration BMP. The Front Cistern overflows to the permeable concrete pavement which contains an underdrain discharging to the East Bioinfiltration Basin. Lastly, the Rear Cistern acts as a standalone BMP. This configuration is shown in the schematic.
The treatment train provides an annual removal efficiency of 67 percent runoff volume for the site as well as 67 percent total phosphorus and 68 percent TSS. The MIDS calculator annual performance results of the BMP treatment train as a whole are summarized in the table below. This system exceeds the performance goals of 50 percent reduction in both runoff volume, TP, and TSS.
| Volume | Performance Goal Runoff Volume (acre-ft.) | 4.57 |
| Retention Volume Provided by BMPs (acre-ft.) | 3.07 | |
| Percent Runoff Volume Removed (%) | 67 | |
| Total phosphorus | Performance Goal Particulate P Load (lbs.) | 2.05 |
| Performance Goal Dissolved P Load (lbs.) | 1.39 | |
| Particulate P Load Removed by BMPs (lbs.) | 1.68 | |
| Dissolved P Load Removed by BMPs (lbs.) | 1.68 | |
| Percent TP Removed (%) | 67 | |
| Total suspended solids | Performance Goal TSS Loads (lbs.) | 677 |
| TSS Load Removed by BMPs (lbs.) | 458 | |
| Percent TSS Removed (%) | 68 |
Step 6: Review Construction & Operations Criteria
Each of the BMPs included in the treatment train have unique criteria for construction and operations. Information regarding construction and operations should be reviewed in detail before design and construction of the BMPs take place. Available information for each of the BMPs used in this scenario are provided in the table below. Cistern construction and operations should follow the recommendations of the designer or manufacturer.
| Permeable pavement | Bioinfiltration |
|---|---|
| Construction | Construction |
| Maintenance | Maintenance |
Related articles
- Using the treatment train approach to BMP selection
- Scenario for developing a stormwater treatment train for a parking lot
- Scenario for developing a stormwater treatment train for an ultra-urban setting
- Scenario for developing a stormwater treatment train for a site with limited infiltration capacity
- Scenario for developing a stormwater treatment train for a retrofit site
- Scenario for developing a stormwater treatment train for constructed ponds in new development
- Case studies for stormwater treatment trains
This page was last edited on 12 February 2023, at 13:21.
