Scenario for developing a stormwater treatment train for an ultra-urban setting
Stormwater treatment trains combine multiple stormwater treatment processes and/or practices in a manner that ensures management of all pollutants that could affect a receiving water. To provide guidance for stormwater managers, hypothetical treatment trains were developed for five common stormwater management scenarios. This page provides information on implementing a stormwater Best Management Practice (BMP) treatment train for an ultra-urban setting. To see other scenarios, see related articles at the bottom of this page.
Contents
- 1 Step 1: Review project goals and site conditions
- 2 Step 2: Review Pollutant Removal Processes & Identify Potential Practices
- 3 Step 3: Determine site constraints and BMP placement
- 4 Step 4: Select individual BMPs and evaluate range of performance
- 5 Step 5: Size BMPs and assess performance
- 6 Step 6: Review Construction & Operations Criteria
- 7 Related articles
Step 1: Review project goals and site conditions
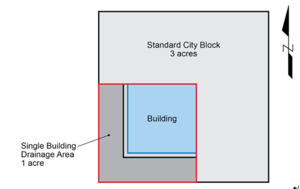
The ultra-urban site is characterized by high impervious cover in the form of residences, parking, or commercial development. For the purposes of this scenario, the drainage conditions for a single building on a city block in downtown Minneapolis, Minnesota were considered. A single city block covers an average area of 2 to 3 acres and generally contains 2 to 4 buildings. For this scenario, it is assumed that a single building, including its frontage, sidewalk and half of the road covers a drainage area of 1 acre, as shown in the schematic to the right.
The basic site conditions for the ultra-urban setting are summarized in the table below.
| Site | Ultra-Urban (Downtown Minneapolis) |
| Drainage Area | 1.0 acre |
| Impervious Area | 95% |
| Soil Conditions | Hydrologic Soil Group ‘B’, silty sands and silty gravelly sands. Permeability ranges between 0.30- 0.45 inches per hour at a depth of 3 feet. Bedrock was not observed in borings conducted on site. |
| Topography & Drainage | Rooftop runoff drains down to street level through downspouts. Street level runoff drains to the southwest corner of the city block. |
| Project Goals | Reduce stormwater runoff volume and pollutant loads by decreasing impervious cover to promote infiltration and nutrient uptake. |
High imperviousness results in high velocity and erosive stormwater flows that can damage building integrity and overwhelm stormwater infrastructure. The soil is assumed to be compacted due to high urbanization. Lack of vegetation and infiltration opportunities also prevent pollutant removal which leads to reduced water quality. The goal of this project is to install a BMP treatment train to reduce runoff volume and pollutant loads for the Water Quality Event.
Step 2: Review Pollutant Removal Processes & Identify Potential Practices
The BMPs selected for this site must achieve the goals of decreased runoff volume and pollutant removal, as well as fit within the site constraints. The following table summarizes the BMP categories and their applicability to this site.
| Practice | Applicability | Reason |
|---|---|---|
| Pollution prevention and public education | Pollution Prevention will be implemented during site maintenance. | |
| Source controls | Additional maintenance for source controls is not intended for this site; this is not an applicable practice. | |
| Infiltrators | X | Allows for total stormwater and pollutant capture and aesthetically pleasing for pedestrians. |
| Swales and strips | Not applicable for a highly urbanized city block. | |
| Filters | X | Allows for reduction of stormwater volume and pollutant loads and easy diversion to other BMPs. |
| Constructed basins | Too large to meet space constraints. | |
| Manufactured devices [1], [2] | Applicable, however more aesthetically pleasing options should be pursued first. | |
| Storage, harvesting and reuse | Applicable depending on available space and building function. However, stormwater storage for re-use is not necessary for this scenario. |
Infiltrator and filter BMPs are determined to best address the goals of this project. The process of selecting and placing BMPs on a site is typically iterative, working between the site constraints, project goals, and available budget. The approach and considerations for this scenario are discussed in the following sections.
Step 3: Determine site constraints and BMP placement
An ultra-urban setting can pose a unique set of site constraints due to limited space for development and high pedestrian traffic. Specific site constraints for a typical city block in Minneapolis include:
- Available space – In the ultra-urban setting the location of BMPs is restricted to rooftops and the narrow corridor between buildings and city streets. Impervious surfaces in the drainage area are necessary for supporting high foot and vehicle traffic, as well as structural support of buildings. Selected BMPs must be able to effectively reduce the adverse effects of stormwater while maintaining the function of the existing impervious surfaces.
- Public integration – Ultra-urban settings are usually characterized by high volumes of pedestrian and vehicular traffic. Selected BMPs must be resistant to degradation due to constant use. BMP aesthetics should also be a consideration.
- Utilities – when working in a downtown or ultra-urban setting, there is often little flexibility in the location and movement of utilities. BMP sizing and location should try to avoid major impact utilities.
- Regulatory Requirements - All local, state, and federal regulatory requirements must be met. The design criteria and recommendations from the Minnesota Stormwater Manual will be followed.
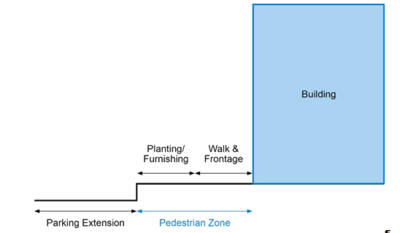
To meet space allotments and reduce degradation due to interaction with people and vehicles, the most viable locations for BMPs are the building rooftop, the pedestrian sidewalk and parking/bike lane. For reference, the street level areas are depicted in the schematic to the right.
Further considerations for placement of BMPs on the street level are the required minimum dimensions for high capacity roads, curbs, sidewalks and planting and furnishing zones as well as the 10 foot minimum setback from a building foundation.
Step 4: Select individual BMPs and evaluate range of performance
Step 2 introduced the practices that would best address the goals and site constraints for the ultra-urban setting as infiltrators and filters. Infiltration is a hydraulic process that serves to reduce runoff volume and pollutant loads by complete abstraction of runoff. Physical, chemical and biological processes remove pollutant loads as water moves through the media mix. In contrast, filtration is a physical process that uses the same physical, chemical and biological principles to reduce pollutant loads as water moves through the media. However, excess water is drained through an underdrain.
- Filter: Green Roof
- Green roofs are primary treatment BMPs which act as filters. Installing a green roof substantially reduces impervious cover and the volume and rate of water draining to the street level. Green roofs have a median total suspended solid (TSS) removal of 85 percent. Although green roofs do not have high rates of total phosphorus (TP) removal, in a northern temperate region such as Minnesota a green roof can reduce runoff volume by 50 percent to 70 percent. Volume and rate reduction will reduce loading on downstream BMPs allowing for more effective pollutant reduction. Studies show that green roofs actually become more effective over time. As vegetation becomes more established, water quality may improve due to mature plants ability absorb and filter more pollutants. A green roof will allow for reduction in runoff volume, peak discharge, delay peak runoff, and divert excess water to downstream BMPs for further pollutant reduction.
- Infiltrator: Tree Trench/Box System
- Tree trenches and boxes on the street level between the sidewalk and street can capture and reduce runoff from the road, sidewalk, and underdrain outlet from the green roof. Tree trenches/boxes act as infiltrators where the soil media, trees and microbes work in conjunction to absorb, filter or transform pollutants. The media in tree trenches/boxes also holds pollutants to be utilized by vegetation or microbes during periods of low rainfall. Soil Media Mix D is recommended for tree BMPs. Together they provide the most effective design for nutrient and pollutant removal because of the interplay of physical, chemical and biological processes. Infiltration basins could provide similar runoff volume and pollutant reductions, however because this was an area with high pedestrian interaction, tree trenches/boxes provide a higher aesthetic value.
- Infiltrator: Permeable Pavement
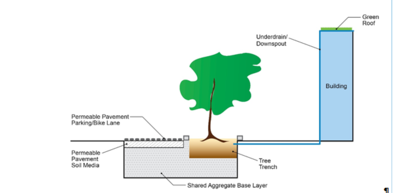
- Permeable pavement acts as a final filter to remove phosphorus and other pollutants and to reduce road and storm sewer flooding. Although permeable pavements can be prone to clogging in areas of high TSS loading, the preceding BMPs will reduce pollutant loading from the sidewalk and buildings, and allow for more effective pollutant removal from the adjacent impervious street. Permeable pavement offers structural stability to allow for traffic loading from cars and bikes, while allowing water to infiltrate through voids in the surface. The aggregate storage media under the permeable pavement and tree boxes will be a single unit as shown in the figure to the right, allowing for captured stormwater and pollutants to be available for vegetation in the tree trenches/boxes.
A multitude of infiltrator or filter BMPs may be considered for an Ultra-Urban setting where the goals of stormwater management are the reduction of runoff volumes and pollutant loads. A green roof, tree trenches, and permeable pavement were selected as plausible treatment train BMPs for this scenario.
Step 5: Size BMPs and assess performance
For the ultra-urban setting, space is a significant site constraint. BMP sizing must be strategic to allow for maximum BMP efficiency while meeting performance goals. Assumptions included an annual phosphorus event mean concentration (EMC) of 0.3 milligrams per liter, and an annual TSS EMC of 54.5 milligrams per liter. The following table summarizes the existing site runoff, volume and pollutant retention goals. The MIDS calculator provides a performance goal requirement based on the site conditions for the treatment train which is shown in the table below.
| Annual runoff volume (acre-feet | Annual particulate phosphorus load (lbs) | Annual dissolved phosphorus load (lbs) | Annual total suspended solids load (lbs) | Performance goal volume retention requirement (ft3 |
|---|---|---|---|---|
| 2.15 | 0.96 | 0.79 | 319 | 3793 |
BMP Sizing for each component of a treatment train is an iterative process where available space, performance goals and regulatory requirements must be considered.
Green roof
| Parameter | Value |
|---|---|
| Runoff Volume from Direct Watershed (ft3) | 2832 |
| Runoff Volume from Upstream BMPs (ft3) | 0 |
| Retention Volume Provided by BMP (ft3) | 2734 |
| Outflow Volume from BMP (ft3) | 98 |
| Percent Performance Goal Achieved (%) | 97 |
| Roof area (ft2) | Media depth (in) |
|---|---|
| 24852 | 4 |
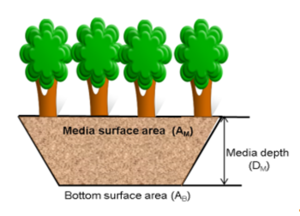
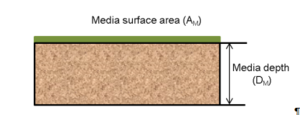
The design of a green roof is based around the input parameters needed for the MIDS calculator for green roofs. The MIDS calculator is able to determine the performance of the green roof BMP based on the parameters shown in the schematic to the right.
The surface area of a green roof is controlled by the available area on the building rooftop. The rooftop size is dictated by the space available on the existing building. The sizing input parameters for the green roof are shown in the table below.
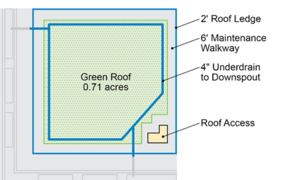
For this setting, space was allotted for a 6 foot walkway around the perimeter of the green roof to provide maintenance access to the BMP without hindering its functionality and the performance. To route excess water to the downstream BMPs on the south and west side of the building, two 4-inch downspouts were included. Two downspouts reduce the risk of clogging and provides an extra outlet for water if one downspout is undergoing maintenance. A schematic of the green roof design is shown to the right.
These parameters were entered into the MIDS calculator to evaluate performance of the green roof BMP for runoff volume and pollutant load reductions. These results are summarized in the adjacent tables.
| Pollutant | Parameter | Value |
|---|---|---|
| Volume | Runoff from Direct Watershed (acre-ft.) | 0.00 |
| Runoff from Upstream BMPs (acre-ft.) | 1.59 | |
| Retention Volume Provided by BMP (acre-ft.) | 0.79 | |
| Outflow Volume from BMP (acre-ft.) | 0.87 | |
| Percent Performance Goal Achieved (%) | 45 | |
| Particulate phosphorus | Particulate P from Watershed (lbs.) | 0.72 |
| Particulate P from Upstream BMPs (lbs.) | 0 | |
| Particulate P Load Reduction (lbs.) | 0 | |
| Particulate P Outflow | 0.72 | |
| Total Percent Particulate P Reduction | 0 | |
| Dissolved phosphorus | Dissolved P from Watershed (lbs.) | 0.58 |
| Dissolved P from Upstream BMPs (lbs.) | 0 | |
| Dissolved P Load Reduction (lbs.) | 0 | |
| Dissolved P Outflow | 0.58 | |
| Total Percent Dissolved P Reduction (%) | 0 | |
| Total suspended solids (TSS) | TSS from Watershed (lbs.) | 236 |
| TSS from Upstream BMPs (lbs.) | 0 | |
| TSS Load Reduction (lbs.) | 226 | |
| TSS Outflow | 10 | |
| Total Percent TSS Reduction (%) | 96 |
Tree trench/Box system
| Pollutant | Parameter | Large trench | Small trench |
|---|---|---|---|
| Volume | Runoff from Direct Watershed (acre-ft.) | 0.05 | 0.03 |
| Runoff from Upstream BMPs (acre-ft.) | 0.44 | 0.00 | |
| Retention Volume Provided by BMP (acre-ft.) | 0.49 | 0.03 | |
| Outflow Volume from BMP (acre-ft.) | 0.00 | 0.00 | |
| Percent Performance Goal Achieved (%) | 100 | 100 | |
| Particulate phosphorus | Particulate P from Watershed (lbs.) | 0.02 | 0.01 |
| Particulate P from Upstream BMPs (lbs.) | 0.36 | 0.00 | |
| Particulate P Load Reduction (lbs.) | 38 | 0.01 | |
| Particulate P Outflow | 0.00 | 0.00 | |
| Total Percent Particulate P Reduction | 100 | 100 | |
| Dissolved phosphorus | Dissolved P from Watershed (lbs.) | 0.02 | 0.01 |
| Dissolved P from Upstream BMPs (lbs.) | 0.29 | 0.00 | |
| Dissolved P Load Reduction (lbs.) | 0.31 | 0.01 | |
| Dissolved P Outflow | 0.00 | 0.00 | |
| Total Percent Dissolved P Reduction (%) | 100 | 100 | |
| Total suspended solids (TSS) | TSS from Watershed (lbs.) | 7 | 4 |
| TSS from Upstream BMPs (lbs.) | 5 | 0 | |
| TSS Load Reduction (lbs.) | 12 | 4 | |
| TSS Outflow | 0 | 0 | |
| Total Percent TSS Reduction (%) | 100 | 100 |
| Parameter | Large trench | Small trench |
|---|---|---|
| Runoff Volume from Direct Watershed (ft3) | 80 | 48 |
| Runoff Volume from Upstream BMPs (ft3) | 49 | 0 |
| Retention Volume Provided by BMP (ft3) | 419 | 209 |
| Outflow Volume from BMP (ft3) | 0 | 0 |
| Percent Performance Goal Achieved (%) | 100 | 100 |
| Top surface area (ft2) | Bottom surface area (ft2) | Media depth (ft) | Number of trees | Required drawdown time (hrs) |
|---|---|---|---|---|
| 420 | 420 | 3 | 2 | 48 |
| 210 | 210 | 3 | 1 | 48 |
The design of a tree trench BMP is based around the input parameters needed for the MIDS calculator for tree trenches without underdrains. The MIDS calculator configuration for the tree trench BMP is illustrated in the figure to the right.
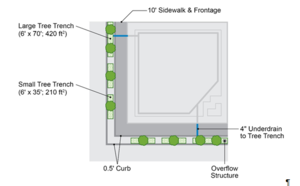
Two types of tree trenches were designed for this setting. Two large tree trenches were placed at the outlets of each downspout to account for flow from the upstream green roof BMP as well as runoff from the adjacent sidewalk. Four small tree trenches were added to intercept runoff from the sidewalk, preventing flow into the street. Sizing of the tree trenches is limited by pedestrian zone spacing requirements. Installations in the pedestrian zone should conform to all local rules and regulations. This Ultra-Urban scenario was set in downtown Minneapolis, MN and as such, sizing for the frontage, sidewalk and planting zones are determined based on the Minneapolis Public Works Pedestrian Facility Design Guidelines. The required 10 foot minimum setback for infiltration practices from a building foundation and soil volume requirements for the chosen tree type also factored into tree trench sizing. The tree trench sizing input parameters are summarized in the table below.
The tree types and sizes for the tree trench system BMPs are restricted by the available soil volume. Deciduous trees are most suitable for the ultra-urban design as they provide more clearance for pedestrian passage around the trees. The table below shows the tree inputs for the MIDS calculator.
The MIDS calculator also accounts for soil media within the tree trench system, underlying soils, and tree types. As previously stated, Media Mix D is highly recommended for best results with a tree BMP. The selected media mix dictates the MIDS inputs for soil-water storage properties, including a media field capacity of 0.09 cubic feet per cubic foot and a media porosity of 0.31 cubic feet per cubic foot. Although the area’s underlying Hydrologic Soil Group B is relatively well-draining with an infiltration rate of 0.45 inches per hour, high soil compaction was assumed because of the intense urbanization. Therefore an overflow structure was included in the tree trench for larger storm bypass and reduced infiltration capacity over time. The figure to the right displays the overall layout for the tree trench system.
These parameters were entered into the MIDS calculator to evaluate performance of the tree trench BMPs for runoff volume and pollutant load reductions. These results are summarized below.
Permeable pavement
| Pollutant | Parameter | Value |
|---|---|---|
| Volume | Runoff from Direct Watershed (acre-ft.) | 0.29 |
| Runoff from Upstream BMPs (acre-ft.) | 0..00 | |
| Retention Volume Provided by BMP (acre-ft.) | 0.29 | |
| Outflow Volume from BMP (acre-ft.) | 0.00 | |
| Percent Performance Goal Achieved (%) | 100 | |
| Particulate phosphorus | Particulate P from Watershed (lbs.) | 0.13 |
| Particulate P from Upstream BMPs (lbs.) | 0.00 | |
| Particulate P Load Reduction (lbs.) | 0.13 | |
| Particulate P Outflow | 0.00 | |
| Total Percent Particulate P Reduction | 100 | |
| Dissolved phosphorus | Dissolved P from Watershed (lbs.) | 0.11 |
| Dissolved P from Upstream BMPs (lbs.) | 0.00 | |
| Dissolved P Load Reduction (lbs.) | 0.11 | |
| Dissolved P Outflow | 0.00 | |
| Total Percent Dissolved P Reduction (%) | 100 | |
| Total suspended solids (TSS) | TSS from Watershed (lbs.) | 43 |
| TSS from Upstream BMPs (lbs.) | 0 | |
| TSS Load Reduction (lbs.) | 43 | |
| TSS Outflow | 0 | |
| Total Percent TSS Reduction (%) | 100 |
| Parameter | Large trench | Small trench |
|---|---|---|
| Runoff Volume from Direct Watershed (ft3) | 518 | |
| Runoff Volume from Upstream BMPs (ft3) | 0 | |
| Retention Volume Provided by BMP (ft3) | 3469 | |
| Outflow Volume from BMP (ft3) | 0 | |
| Percent Performance Goal Achieved (%) | 100 |
| Top surface area (ft2) | Surface area at subgrade (ft2) | Storage depth (ft) | Required drawdown time (hrs) |
|---|---|---|---|
| 4818 | 4818 | 1.8 | 48 |
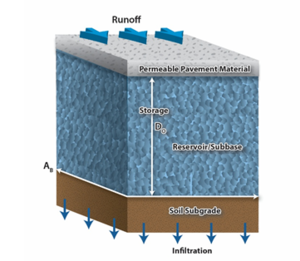
The design of a permeable pavement parking/bike lane is based around the input parameters needed for the MIDS calculator for permeable pavement. A typical permeable pavement configuration is shown in the figure to the right.
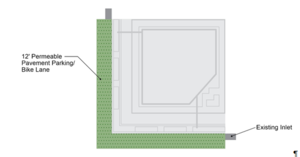
The sizing of the permeable pavement parking/bike lane varies depending on the scenario and available space and should conform to all local rules and regulations for transportation zones. This ultra-urban scenario was set in downtown Minneapolis, MN and as such local sizing guidelines for traffic ways, parking lanes and bike lines were considered. The Minneapolis Public Works Street and Sidewalk Design Guidelines offers desired minimum lane widths for urban roads, parking and bike lanes. These recommendations conform to the minimum design standards set forth by the Minnesota Administrative Rules. The dimensions for the permeable pavement lane, including space for parking and bike passage, were designed to be 12 feet wide and extend the length of the block. This meets the [Minneapolis Public Works Design Guidelines for Streets and Sidewalks Minneapolis Public Works Design Guidelines for Streets and Sidewalks] requirements for the minimum functional lane widths.
Additional considerations for permeable pavement sizing are depth of the aggregate reservoir and the required drawdown time. The sizing input parameters for the permeable pavement BMP are summarized below.
Although the underlying Hydrologic Soil Group B is considered to be well draining with an infiltration rate of 0.45 inches per hour, high soil compaction was assumed because this is a highly urbanized area. In addition, the permeable pavement BMP will need to support vehicular loads and therefore further compaction of underlying soils may be required. For this reason, an existing inlet will be maintained directly downstream of the permeable pavement for bypass and overflow from larger storm events. The porosity of the aggregate media was assumed to be 0.4 cubic feet per cubic foot. These parameters were input into the MIDS calculator to evaluate the pollutant removal and volume reduction performance of the BMP. The results of the MIDS credit calculations for volume reduction and pollutant loading are shown below.
Overall ultra-urban BMP treatment train performance
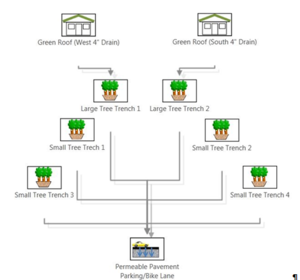
The overall performance of the BMP treatment train was evaluated using the MIDS calculator. The treatment train configuration consisting of a green roof, 2 large tree trenches, 4 small tree trenches and a permeable pavement parking/bike lane is shown on the right.
This treatment train was able to significantly reduce the volume and pollutant loadings in this ultra-urban setting. The treatment train achieved removal efficiencies of 97 percent for each of the components of interest: runoff volume, total phosphorus and TSS. The results from the MIDS calculator run are summarized in the following table.
| Volume | Performance Goal Runoff Volume (acre-ft.) | 2.15 |
| Retention Volume Provided by BMPs (acre-ft.) | 2.09 | |
| Percent Runoff Volume Removed (%) | 97 | |
| Total phosphorus | Performance Goal Particulate P Load (lbs.) | 0.96 |
| Performance Goal Dissolved P Load (lbs.) | 0.79 | |
| Particulate P Load Removed by BMPs (lbs.) | 0.93 | |
| Dissolved P Load Removed by BMPs (lbs.) | 0.77 | |
| Percent TP Removed (%) | 97 | |
| Total suspended solids | Performance Goal TSS Loads (lbs.) | 319 |
| TSS Load Removed by BMPs (lbs.) | 309 | |
| Percent TSS Removed (%) | 97 |
Step 6: Review Construction & Operations Criteria
Each of the BMPs included in the treatment train have unique criteria for construction and operations. Information regarding construction and operations should be reviewed in detail before design and construction of the BMPs take place. Available information for each of the BMPs is provided below.
| Green roof | Tree trench | Permeable pavement |
|---|---|---|
| Construction | Construction | Construction |
| Maintenance | Maintenance | Maintenance |
Related articles
- Using the treatment train approach to BMP selection
- Scenario for developing a stormwater treatment train for a parking lot
- Scenario for developing a stormwater treatment train for an ultra-urban setting
- Scenario for developing a stormwater treatment train for a site with limited infiltration capacity
- Scenario for developing a stormwater treatment train for a retrofit site
- Scenario for developing a stormwater treatment train for constructed ponds in new development
- Case studies for stormwater treatment trains
This page was last edited on 12 February 2023, at 13:33.
