Scenario for developing a stormwater treatment train for constructed ponds in new development
Stormwater treatment trains combine multiple stormwater treatment processes and/or practices in a manner that ensures management of all pollutants that could affect a receiving water. To provide guidance for stormwater managers, hypothetical treatment trains were developed for five common stormwater management scenarios. This page provides information on implementing a stormwater Best Management Practice (BMP) treatment train for a site having ponds in series. To see other scenarios, see related articles at the bottom of this page.
Contents
- 1 Step 1: Review project goals and site conditions
- 2 Step 2: Review pollutant removal processes and identify potential practices
- 3 Step 3: Determine site constraints and BMP placement
- 4 Step 4: Select individual BMPs and evaluate range of performance
- 5 Step 5: Size BMPs and assess their performance
- 6 Step 6: Review construction and operations criteria
- 7 Related articles
Step 1: Review project goals and site conditions
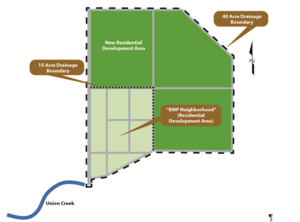
This scenario is for a new commercial/residential development in an agricultural area adjacent to a rural town. Current land use consists of row crop agriculture. Several buildings are located near the southern portion of the area and it is known that vehicle fueling and pesticide storage and handling occurred in this area. The new development is to be 40 acres consisting of four 10-acre sub-neighborhoods. The upstream neighborhoods have slopes of 2 percent draining to the downstream southwest neighborhood, hereby referred to as the “BMP Neighborhood.” At the southwest corner of the BMP Neighborhood is an outlet to Union Creek, which continues southwest to a small lake. This lake is known to be nutrient impaired with excess levels of phosphorus, possibly due to fertilizer use from upstream agricultural areas.
Because more than 1 acre of new impervious surface is being created the site must meet the requirements of the Construction Stormwater General Permit. A site investigation reveals soils in the southwestern part of the area are contaminated with fuel oils and agricultural pesticides. The permit prohibits infiltration in areas having soil contamination; however soils over the remainder of the area are not contaminated.
For this scenario two treatment train options will be evaluated. First is a varied BMP approach in which the 1 inch volume reduction requirement in the permit will be met. The second option utilizes a stormwater ponds in series approach. The existing site layout can be seen in the schematic to the right. The table below describes the site conditions for this new development.
| Site | New residential development |
| Drainage Area | 40 acres |
| Impervious Area | 40% |
| Soil Conditions | Hydrologic Soil Group ‘B’, silty sands and silty gravelly sands with moderate infiltration rates. Permeability ranges between 0.30- 0.45 inches per hour at a depth of 3 feet. Bedrock was not observed in borings conducted on site. Soils in the southwestern portion of the site are contaminated with fuel oils and pesticides. |
| Topography & Drainage | Three upstream neighborhoods have gentle 2% slopes towards downstream BMP Neighborhood which flattens to a 0.5% slope and drains into the adjacent Union Creek. |
| Project Goals | Reduce stormwater runoff volume or peak flow rate and pollutant loads to Union Creek. One scenario will attempt to meet a volume reduction requirement of 1 inch, while another scenario will avoid infiltration based on an assumption of contaminated soils on the site. |
Step 2: Review pollutant removal processes and identify potential practices
The BMPs selected for the site need to achieve the goals of decreased runoff volume or peak flow rate attenuation and pollutant removal, as well as fit within the site constraints. The table below summarizes the applicability of different BMP practices to this site.
Infiltrators, filters, swales and strips, and constructed basins are determined to best address the goals of this project. The process of selecting and placing BMPs on a site is typically iterative, working between the site constraints, project goals, and available budget. The approach and considerations for this scenario are discussed in the following sections.
| Practice | Applicability | Reason |
|---|---|---|
| Pollution prevention and public education | Pollution prevention will be considered as a part of site and BMP maintenance. | |
| Source controls | This is not an applicable practice for this site. | |
| Infiltrators | X | Allows for total stormwater and pollutant capture and is aesthetically pleasing for pedestrians and residents. |
| Swales and strips | X | Allows for filtration of stormwater and transport of excess stormwater without using typical “gray” methods of conveyance such as curb and gutter and storm sewer. |
| Filters | X | Allows for reduction of stormwater volume and pollutant loads and easy diversion to other BMPs. |
| Constructed basins | X | Area allows for large water retention to capture excess runoff. |
| Manufactured devices [1], [2] | Applicable, however more aesthetically pleasing options should be pursued first. | |
| Storage, harvesting and reuse | Applicable depending on available space and water needs. This scenario assumed no space or need for stormwater storage or reuse. |
Step 3: Determine site constraints and BMP placement
The site constraints will influence successful BMP integration within this residential community. These constraints must be considered with BMP selection and design. Some specific site constraints for this scenario include the following.
- Available Space – The existing road configuration in the southwestern part of the area should remain to avoid additional unnecessary costs of redesigning and reconstructing roads. Selected BMPs must fit within the already existing pervious areas.
- Public Integration – New development settings are usually characterized by residential neighborhoods with high interaction between the public and their environment. Selected BMPs should add to the aesthetic value of the neighborhood and be safe for interaction with all ages.
- Utilities – Utilities will have to be constructed or adjusted to meet the requirements of a new residential area. BMP sizing and location should try to avoid major conflict with existing or planned utilities.
- Contaminated soils - Infiltration must be avoided in areas with contaminated soils.
- Regulatory Requirements - All local, state, and federal regulatory requirements must be met. The design criteria and recommendations from the Minnesota Stormwater Manual will be followed.
The southwest quadrant, where soils are contaminated, is a viable location for non-infiltration BMPs and commercial development. The BMPs should be designed to fit within the already pervious areas to prevent construction to the existing roads. Further considerations for placement of BMPs are the required minimum dimensions for rural residential roads, curbs, sidewalks and right-of-way zones as well as minimum setback requirements.
Step 4: Select individual BMPs and evaluate range of performance
Step 2 introduced the practices that would best address the goals and site constraints for a new development scenario as infiltrators, filters, swales and strips, and constructed basin BMPs. Various BMPs may be considered for this scenario, where the goals of stormwater management are the reduction of runoff volumes and pollutant loads. However, two treatment train options were evaluated. The first was a varied BMP approach and the second was a scenario with 2 stormwater ponds used in series. The selected BMPs are discussed in the following sections.
Step 4.1: BMP selection for a varied BMP approach
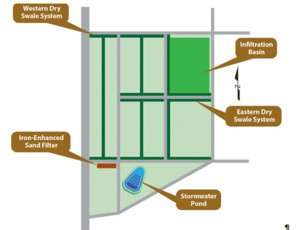
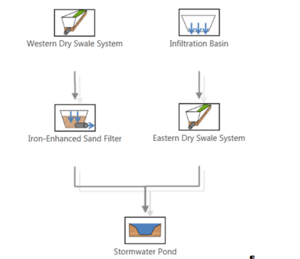
The following BMPs were evaluated as plausible treatment train options for a new development scenario in which multiple types of BMPs were utilized (called the Varied BMP Approach). The schematic to the right illustrates the layout for this scenario.
- Infiltrator: infiltration basin
An infiltration basin allows for a pervious open area that could provide both infiltration and attenuation of stormwater runoff. The basin can incorporate grass vegetation to provide an open activity space for the community during dry weather periods. This will be placed in the northeast corner of the BMP neighborhood allowing for capture of stormwater from the upstream 30 acre residential drainage area. This location is ideal because its size is large enough to provide significant stormwater capture as well as room for recreation.
- Filter: Dry Swale System
Vegetated filters such as dry swales can replace conventional storm sewers to provide a greener and more aesthetic corridor for the neighborhood. The dry swales will be used as a pathway to transport water from the upstream end of the BMP Neighborhood to the downstream BMPs near the outlet at Union Creek. In the process the dry swales can remove water pollutants by filtering water through the filter bed media as well as provide pretreatment to downstream BMPs. Media mixes with the highest organic matter content provide the most pollutant removal, although phosphorus may be leached from organic matter and transported to an underdrain if the phosphorus concentration in the media exceeds 30 milligrams per kilogram of soil. Excess water will be transported through an underdrain suspended in a gravel layer below the filter bed media.
- Filter: Iron-Enhanced Sand Filter (Minnesota Filter)
This rural region of Minnesota is characterized by agricultural land use and likely high inputs of fertilizer. The lake at the discharge point of Union Creek is known to be impaired with high nutrient loading. An iron-enhanced sand filter located upstream of the outlet to Union Creek is proposed to maximize the removal of dissolved phosphorus. An iron enhanced sand filter has median TSS removal rates of 85 percent, and TP removal rates of 77 percent. It is also effective at removing nitrogen, metals, bacteria, and other pollutants. Note that the MIDS calculator does not allow for adjustments in phosphorus loading from sand filters based on the presence of amendments such as iron.
- Constructed Basin: Stormwater Pond
A constructed stormwater pond in the southwest corner of the BMP Neighborhood allows for final capture and treatment of stormwater without impacting the contaminated soils in that area. Although a stormwater pond does not contribute to overall volume reduction it allows for volume control to the downstream creek through peak attenuation. Water may be retained in the stormwater pond first and then released through an appropriately sized outlet. The stormwater pond will be designed to meet Level 3 requirements for maximum TSS and total phosphorus removal. Stormwater ponds can expect pollutant removal for TSS of 84 percent and a TP removal of 50 percent.
Step 4.2: BMP selection for stormwater ponds in series
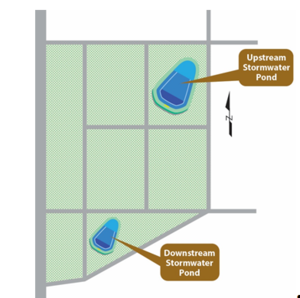
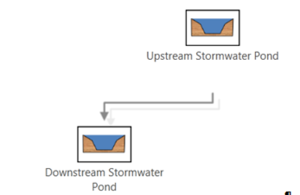
This approach maintains the downstream stormwater pond. However a larger upstream stormwater pond replaces the other BMPs at the location of the former infiltration basin, as depicted in the schematic to the right. This stormwater pond is also designed to meet the Level 3 requirements for maximum TSS and TP removal. Although stormwater ponds do not contribute to reduction of runoff volume, they allow for water retention and controlled water release. Volume control prevents unwanted ponding by capturing water in the constructed ponds and releasing it at a rate such that the capacity of the natural soils, vegetation, and downstream waterbody is not overwhelmed in a storm event.
A cost-benefit evaluation of implementing two versus three stormwater ponds in series was completed. It was determined that two ponds would require less initial capital and future operations and maintenance costs. The MIDS calculator also showed that two ponds would perform to a standard exceeding that of three ponds for TSS and TP removal
Step 5: Size BMPs and assess their performance
BMPs for this scenario have both qualitative and quantitative goals. BMP sizing and placement must consider the quantitative performance goals, but also enhance the aesthetic quality of the community for residents. The MIDS calculator was used to quantify volume and pollutant reductions. Assumptions included a phosphorus event mean concentration (EMC) of 0.3 milligrams per liter and an annual TSS EMC of 54.5 milligrams per liter. The following table summarizes the existing site runoff volume and pollutant retention goals.
| Annual runoff volume (acre-feet | Annual particulate phosphorus load (lbs) | Annual dissolved phosphorus load (lbs) | Annual total suspended solids load (lbs) | Performance goal volume retention requirement (ft3 |
|---|---|---|---|---|
| 36.94 | 16.58 | 13.57 | 5477 | 57898 |
Step 5.1: Varied BMP approach
BMP sizing for each component of a treatment train is an iterative process where available space, performance goals and regulatory requirements must be considered. The BMPs were sized to best meet the project performance goals within the parameters of the site.
- Infiltration basin
| Parameter | Value |
|---|---|
| Runoff Volume from Direct Watershed (ft3) | 65340 |
| Runoff Volume from Upstream BMPs (ft3) | 0 |
| Retention Volume Provided by BMP (ft3) | 48089 |
| Outflow Volume from BMP (ft3) | 17251 |
| Percent Performance Goal Achieved (%) | 100 |
| Surface area at overflow (ft2) | Media surface area (ft2) | Overflow depth (ft) | Drawdown time (hrs) |
|---|---|---|---|
| 39200 | 31519 | 1.36 | 48 |
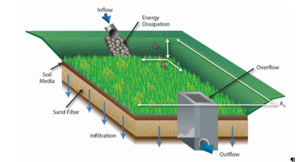
The primary goal when sizing an infiltration basin is to treat the stormwater runoff from the upstream residential drainage area. The schematic at the right shows a typical configuration and components of an infiltration basin. The basin itself will rely solely on infiltration into existing soils in the ponding area of the BMP within the required drawdown time. Excess flows will be directed to the overflow and released at non-erosive rates to the downstream dry swale system.
The major constraints for sizing the basin include the ponding area, the basin area, and the depth of the ponding area. The available space in the open area in the northern portion of the BMP Neighborhood limits the maximum ponding area of the basin. This is controlled by the recommended 10 foot setback from the streets to avoid the infiltration basin being directly connected to pavement foundations and to avoid seepage and frost heave concerns, per MPCA design criteria. This 10 foot buffer provides pretreatment of direct runoff not routed through the upstream BMPs, allowing for impervious surface disconnection over a grass strip between the street pavement and the infiltration basin. The basin itself will extend the entire width and length of the parcel, less the recommended 10 foot offset. The ponding area will include a shallower 10:1 side slope to the basin bottom to keep the space easily accessible to the public.
Because infiltration cannot be implemented in the area of the site where soils are contaminated, the infiltration basin must be sized to capture additional runoff to meet the overall site goal of 1 inch from impervious surfaces. The basin depth is therefore set at 1.36 feet. The sizing parameters for the infiltration basin are described in the table below. Excess stormwater collected in the infiltration basin will be routed through the dry swale system to the remaining downstream treatment train BMPs.
These parameters were entered into the MIDS calculator to evaluate the performance of the BMP. The results are summarized below. For information on using the MIDS calculator for infiltration basins, link here.
| Pollutant | Parameter | Value |
|---|---|---|
| Volume | Runoff from Direct Watershed (acre-ft.) | 27.27 |
| Runoff from Upstream BMPs (acre-ft.) | 0.00 | |
| Retention Volume Provided by BMP (acre-ft.) | 25.23 | |
| Outflow Volume from BMP (acre-ft.) | 2.05 | |
| Annual Runoff Volume Achieved (%) | 92 | |
| Particulate phosphorus | Particulate P from Watershed (lbs.) | 12.24 |
| Particulate P from Upstream BMPs (lbs.) | 0.00 | |
| Particulate P Load Reduction (lbs.) | 11.32 | |
| Particulate P Outflow | 0.92 | |
| Total Percent Particulate P Reduction | 92 | |
| Dissolved phosphorus | Dissolved P from Watershed (lbs.) | 10.02 |
| Dissolved P from Upstream BMPs (lbs.) | 0.00 | |
| Dissolved P Load Reduction (lbs.) | 9.27 | |
| Dissolved P Outflow | 0.00 | |
| Total Percent Dissolved P Reduction (%) | 92 | |
| Total suspended solids (TSS) | TSS from Watershed (lbs.) | 4043 |
| TSS from Upstream BMPs (lbs.) | 0 | |
| TSS Load Reduction (lbs.) | 3739 | |
| TSS Outflow | 304 | |
| Total Percent TSS Reduction (%) | 92 |
- Dry swale system
| Parameter | Western dry swale | Eastern dry swale |
|---|---|---|
| Runoff Volume from Direct Watershed (ft3) | 4991 | 4991 |
| Runoff Volume from Upstream BMPs (ft3) | 0 | 16092 |
| Retention Volume Provided by BMP (ft3) | 4260 | 5723 |
| Outflow Volume from BMP (ft3) | 731 | 15360 |
| Percent Performance Goal Achieved (%) | 85 | 27 |
| Swale design | Total cumulative channel length (ft) | Slope (%) | Side slope (V:H) | Bottom width (ft) | Bioretention base depth (ft) | Media depth below underdrain (ft) | Drawdown time (hrs) |
|---|---|---|---|---|---|---|---|
| Eastern dry swale | 1708.5 | 0.69 | 1:3 | 10.0 | 2.5 | 1.0 | 48 |
| Western dry swale | 1589.6 | 0.50 | 1:3 | 8.0 | 2.5 | 1.0 | 48 |
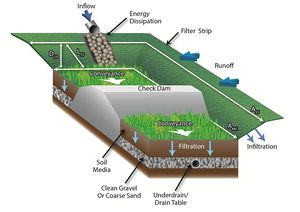
The design of a dry swale system is based on the MIDS calculator requirements for swales with underdrains. A dry swale can incorporate multiple components including check dams, bioretention base, and an underdrain. The typical configuration of a dry swale is shown in the figure to the right. Because the existing topography has mild slopes and the primary purpose of the dry swales in this scenario is to filter and convey runoff from upstream neighborhoods to downstream BMPs, no check dams were included in this design.
The swale system has two functions, to remove stormwater runoff by infiltration below the underdrain and to transport excess runoff from all areas of the BMP Neighborhood to the downstream BMPs without ponding on roadways. To achieve this, a system of swales was designed to convey excess runoff from the infiltration BMP as well as direct overland flow from the remaining drainage area. The swales were placed 4 feet off of the roadway edge and therefore should be placed within the designated Right-of-Way. The length and slope of the dry swale channels are dependent upon the existing topography and dimensions of the pervious areas of the BMP Neighborhood. In locations where swales cross a road or driveway, a small culvert will be installed to allow water to flow between swales without disconnection by impervious roadways. The infiltration basin discharges to the Eastern Dry Swale System, while the remaining drainage area is collected by the Western Dry Swale System.
These parameters were entered into the MIDS calculator to evaluate the performance of the BMP. The results are summarized below.
The Eastern Dry Swale System discharges directly to the downstream stormwater pond. Because the stormwater collected by the Western Dry Swale System will have been minimally treated, it will first be routed through an iron-enhanced sand filter before discharging to the stormwater pond.
| Pollutant | Parameter | Western dry swale | Eastern dry swale |
|---|---|---|---|
| Volume | Runoff from Direct Watershed (acre-ft.) | 3.79 | 3.79 |
| Runoff from Upstream BMPs (acre-ft.) | 0.00 | 6.28 | |
| Retention Volume Provided by BMP (acre-ft.) | 3.13 | 5.40 | |
| Outflow Volume from BMP (acre-ft.) | 0.67 | 4.68 | |
| Percent Performance Goal Achieved (%) | 82 | 54 | |
| Particulate phosphorus | Particulate P from Watershed (lbs.) | 1.70 | 1.70 |
| Particulate P from Upstream BMPs (lbs.) | 0.00 | 2.82 | |
| Particulate P Load Reduction (lbs.) | 1.54 | 3.37 | |
| Particulate P Outflow | 0.16 | 1.16 | |
| Total Percent Particulate P Reduction | 90 | 74 | |
| Dissolved phosphorus | Dissolved P from Watershed (lbs.) | 1.39 | 1.39 |
| Dissolved P from Upstream BMPs (lbs.) | 0.00 | 2.31 | |
| Dissolved P Load Reduction (lbs.) | 1.19 | 2.33 | |
| Dissolved P Outflow | 0.20 | 1.37 | |
| Total Percent Dissolved P Reduction (%) | 86 | 63 | |
| Total suspended solids (TSS) | TSS from Watershed (lbs.) | 562 | 562 |
| TSS from Upstream BMPs (lbs.) | 0 | 932 | |
| TSS Load Reduction (lbs.) | 530 | 1271 | |
| TSS Outflow | 32 | 222 | |
| Total Percent TSS Reduction (%) | 94 | 85 |
- Iron-enhanced sand filter (Minnesota Filter)
| Parameter | Value |
|---|---|
| Runoff Volume from Direct Watershed (ft3) | 0 |
| Runoff Volume from Upstream BMPs (ft3) | 731 |
| Retention Volume Provided by BMP (ft3) | 0 |
| Outflow Volume from BMP (ft3) | 731 |
| Percent Performance Goal Achieved (%) | 0 |
| Ponding area (ft2 | Sand filter media area (ft2) | Ponding depth (ft) | Enhanced filter media depth (ft) | Drawdown time (hrs) |
|---|---|---|---|---|
| 1491 | 781 | 1 | 2 | 48 |
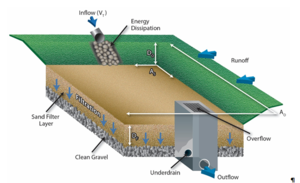
The MIDS calculator was used to compute pollutant reductions for the sand filter. The calculator does not require sizing inputs for non-volume reducing BMPs, which includes sand filters. It is assumed that the sand filter is designed using sizing criteria in the manual. The typical configuration for an enhanced sand filter is shown in the schematic to the right.
The sand filter receives stormwater from the Western Dry Swale System. A cover over the sand filter will be designed to both prevent contamination and as a safety measure for residents. Sand filter sizing is based on its capacity to treat the Water Quality Volume contributing from the Western Dry Swale system within the required drawdown time. Water will collect in the sand filter ponding area where it will drain through the enhanced filter media and discharge to the downstream stormwater pond through an 8 inch underdrain pipe. The sizing parameters for the enhanced sand filter are summarized in the table below.
To determine the performance of the iron-enhanced sand filter design, the MIDS calculator uses credit calculations. Sand filters are not volume reducing BMPs and no credit is therefore given for volume. Pollutant reductions are calculated using assumed pollutant removal percentages that are applied to the entire treatment volume. It is highly important that the BMP is adequately sized to capacitate this entire volume for realistic pollutant removal performance results. Because the calculator does not allow for additional phosphorus removal in an iron-enhanced system, removal of dissolved phosphorus must be calculated using an assumed removal rate of 60 percent. The iron-enhanced sand filter performance results are summarized below.
| Pollutant | Parameter | Value |
|---|---|---|
| Volume | Runoff from Direct Watershed (acre-ft.) | 0.00 |
| Runoff from Upstream BMPs (acre-ft.) | 0.67 | |
| Retention Volume Provided by BMP (acre-ft.) | 0.008 | |
| Outflow Volume from BMP (acre-ft.) | 0.67 | |
| Percent Performance Goal Achieved (%) | 0 | |
| Particulate phosphorus | Particulate P from Watershed (lbs.) | 0.00 |
| Particulate P from Upstream BMPs (lbs.) | 0.16 | |
| Particulate P Load Reduction (lbs.) | 0.14 | |
| Particulate P Outflow | 0.02 | |
| Total Percent Particulate P Reduction | 0 | |
| Dissolved phosphorus | Dissolved P from Watershed (lbs.) | 0.00 |
| Dissolved P from Upstream BMPs (lbs.) | 0.20 | |
| Dissolved P Load Reduction (lbs.) | 0.12 | |
| Dissolved P Outflow | 0.08 | |
| Total Percent Dissolved P Reduction (%) | 60 | |
| Total suspended solids (TSS) | TSS from Watershed (lbs.) | 0 |
| TSS from Upstream BMPs (lbs.) | 32 | |
| TSS Load Reduction (lbs.) | 271 | |
| TSS Outflow | 5 | |
| Total Percent TSS Reduction (%) | 84 |
- Stormwater ponds
| Parameter | Value |
|---|---|
| Runoff Volume from Direct Watershed (ft3) | 0 |
| Runoff Volume from Upstream BMPs (ft3) | 731 |
| Retention Volume Provided by BMP (ft3) | 0 |
| Outflow Volume from BMP (ft3) | 731 |
| Percent Performance Goal Achieved (%) | 0 |
| Total area (ftSuperscript text) | 4712 |
| Width (ft) | 60 |
| Length (ft) | 100 |
| Total storage (ft3) | 40792 |
| Permanent pool storage (ft3) | 14187 |
| Forebay storage (ft3) | 2194 |
| Outlet pool storage (ft3) | 2469 |
| Permanent pool depth (ft) | 4.51 |
| Forebay depth (ft) | 2.05 |
| Outlet pool depth (ft) | 8.00 |
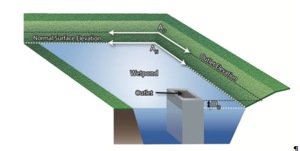
The design of the stormwater pond was based around the MIDS calculator requirements for stormwater ponds. The typical configuration for a stormwater pond BMP is shown in the schematic to the right.
The stormwater pond does not contribute to volume reduction because runoff is not removed from the system, but TP and TSS level are reduced through the physical process of settling, or sedimentation and floating/skimming. The level of TP and TSS removal is determined by the pond Design Level. Although the existing roads provided limits to the surface area of the stormwater pond, there is sufficient room for a Level 3 Stormwater Pond.
The Level 3 Stormwater Pond must meet all criteria for the design level as well as general design criteria. To meet these requirements and capture the runoff volume from the upstream BMPs, the pond was sized as shown in the table below. The determination of these dimensions was an iterative process working within the site constraints, criteria requirements and keeping public safety in mind.
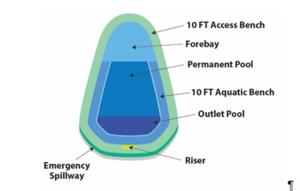
The stormwater pond included the above parameters as well as a 10-foot wide, 0.6-foot deep access bench for maintenance, and a 10-foot wide, 1.5-foot deep aquatic bench for safety and vegetation establishment, as shown in the figure to the right. For volume control, a riser was included in the design so that water could be released at a user defined rate. For the sizing of this pond and drainage area, the maximum discharge rate is 0.61 cubic feet per second. A 2-foot wide emergency spillway was included around the downstream end of the pond to provide safety during a larger storm event.
The MIDS calculator uses credit calculations to determine the performance of the stormwater pond design for the goals of reducing phosphorus loading and TSS loading. For stormwater ponds, these removal percentages are based entirely on the Pond Design Level. While no volume reduction is recognized for a stormwater pond, they are effective at reducing TP and TSS loads. The results of the MIDS credit calculations are shown below. All credit calculations using the MIDS assume that the Stormwater Pond BMP is properly designed, constructed and maintained per the provided criteria.
While no volume reduction is recognized for the stormwater pond, the outflow structure allows a controlled, slow release rate of the stormwater volume to the downstream creek. Though the MIDS calculator assumes this entire Water Quality Event outflow volume from the stormwater pond outflowing instantaneously, the stormwater pond outlet will actually be designed to release at non-erosive rates so that the downstream creek will not be negatively impacted.
| Pollutant | Parameter | Value |
|---|---|---|
| Volume | Runoff from Direct Watershed (acre-ft.) | 0 |
| Runoff from Upstream BMPs (acre-ft.) | 5.35 | |
| Retention Volume Provided by BMP (acre-ft.) | 0 | |
| Outflow Volume from BMP (acre-ft.) | 5.35 | |
| Percent Performance Goal Achieved (%) | 0 | |
| Particulate phosphorus | Particulate P from Watershed (lbs.) | 0.00 |
| Particulate P from Upstream BMPs (lbs.) | 1.17 | |
| Particulate P Load Reduction (lbs.) | 1.05 | |
| Particulate P Outflow | 0.12 | |
| Total Percent Particulate P Reduction | 90 | |
| Dissolved phosphorus | Dissolved P from Watershed (lbs.) | 0.00 |
| Dissolved P from Upstream BMPs (lbs.) | 1.57 | |
| Dissolved P Load Reduction (lbs.) | 0.36 | |
| Dissolved P Outflow | 1.21 | |
| Total Percent Dissolved P Reduction (%) | 23 | |
| Total suspended solids (TSS) | TSS from Watershed (lbs.) | 0 |
| TSS from Upstream BMPs (lbs.) | 227 | |
| TSS Load Reduction (lbs.) | 204 | |
| TSS Outflow | 23 | |
| Total Percent TSS Reduction (%) | 90 |
Step 5.2: Stormwater ponds in series
| Parameter | Upstream SW pond | Downstream SW pond |
|---|---|---|
| Runoff Volume from Direct Watershed (ft3) | 47916 | 9982 |
| Runoff Volume from Upstream BMPs (ft3) | 0 | 47916 |
| Retention Volume Provided by BMP (ft3) | 0 | 0 |
| Outflow Volume from BMP (ft3) | 47916 | 57898 |
| Percent Performance Goal Achieved (%) | 0 | 0 |
| Sizing consideration | Upstream SW pond | Downstream SW pond |
|---|---|---|
| Total area (ftSuperscript text) | 14432 | 4712 |
| Width (ft) | 105 | 60 |
| Length (ft) | 175 | 100 |
| Total storage (ft3) | 130283 | 40792 |
| Permanent pool storage (ft3) | 47343 | 14187 |
| Forebay storage (ft3) | 6534 | 2194 |
| Outlet pool storage (ft3) | 11066 | 2469 |
| Permanent pool depth (ft) | 4.85 | 4.51 |
| Forebay depth (ft) | 1.99 | 2.05 |
| Outlet pool depth (ft) | 8.00 | 8.00 |
The design criteria for stormwater ponds is consistent whether they are to be included in a varied BMP setting or placed in series. The main variable is the drainage area and stormwater volume being treated. Therefore, the design methodology of the stormwater ponds in series were the same as described above. For the best TP and TSS removal, they were also designed to the Level 3 Design standard. However, because the new upstream stormwater pond serves a larger drainage area with no upstream volume reducing BMPs, the size of the pond is larger than the previously designed downstream pond. The table below provides the sizing of both upstream and downstream stormwater ponds.
Although the stormwater ponds follow the Level 3 design, the Upstream Pond has a higher maximum discharge rate of 1.88 cubic feet per second because the pond area is larger than that of Downstream Stormwater Pond. The Downstream Stormwater Pond has a maximum discharge rate of only 0.61 cubic feet per second.
The MIDS calculator provides a summary of the performance goals for this scenario. The performance results are summarized in the table below.
| Pollutant | Parameter | Upstream SW pond | Downstream SW pond |
|---|---|---|---|
| Volume | Runoff from Direct Watershed (acre-ft.) | 29.36 | 7.59 |
| Runoff from Upstream BMPs (acre-ft.) | 0.00 | 29.36 | |
| Retention Volume Provided by BMP (acre-ft.) | 0.00 | 0.00 | |
| Outflow Volume from BMP (acre-ft.) | 29.36 | 36.95 | |
| Percent Performance Goal Achieved (%) | 0 | 0 | |
| Particulate phosphorus | Particulate P from Watershed (lbs.) | 13.18 | 3.4 |
| Particulate P from Upstream BMPs (lbs.) | 0 | 1.32 | |
| Particulate P Load Reduction (lbs.) | 11.86 | 4.25 | |
| Particulate P Outflow | 1.32 | 0.47 | |
| Total Percent Particulate P Reduction | 90 | 90 | |
| Dissolved phosphorus | Dissolved P from Watershed (lbs.) | 10.78 | 2.79 |
| Dissolved P from Upstream BMPs (lbs.) | 0.00 | 8.3 | |
| Dissolved P Load Reduction (lbs.) | 2.48 | 2.55 | |
| Dissolved P Outflow | 8.3 | 8.54 | |
| Total Percent Dissolved P Reduction (%) | 23 | 23 | |
| Total suspended solids (TSS) | TSS from Watershed (lbs.) | 4353 | 1124 |
| TSS from Upstream BMPs (lbs.) | 0 | 435 | |
| TSS Load Reduction (lbs.) | 3918 | 1403 | |
| TSS Outflow | 435 | 156 | |
| Total Percent TSS Reduction (%) | 90 | 90 |
Summary of overall performance
The overall performance of the two BMP Treatment Trains (Varied BMP and Stormwater Ponds in Series) were evaluated using the MIDS calculator. Results are summarized in the table below. The Varied BMP Approach achieved the volume performance goal and achieved 86 percent reductions in volume and pollutant loading, compared to no volume reduction, 84 percent TSS reduction, and 61 percent reduction in total phosphorus. This example illustrates the importance of utilizing an entire site to achieve stormwater management goals even when a portion of the site has constraints.
| Parameter | Varied BMPs | SW Ponds in series | |
| Volume | Performance Goal Runoff Volume (acre-ft.) | 36.95 | 36.95 |
| Retention Volume Provided by BMPs (acre-ft.) | 30.85 | 0 | |
| Percent Runoff Volume Removed (%) | 86 | 0 | |
| Total phosphorus | Performance Goal Particulate P Load (lbs.) | 17.09 | 17.09 |
| Performance Goal Dissolved P Load (lbs.) | 13.99 | 13.99 | |
| Particulate P Load Removed by BMPs (lbs.) | 14.75 | 14.41 | |
| Dissolved P Load Removed by BMPs (lbs.) | 11.59 | 4.56 | |
| Percent TP Removed (%) | 86 | 61 | |
| Total suspended solids | Performance Goal TSS Loads (lbs.) | 5646 | 5646 |
| TSS Load Removed by BMPs (lbs.) | 4876 | 4760 | |
| Percent TSS Removed (%) | 86 | 84 | |
Varied BMP approach
The varied BMP approach consists of an infiltration trench, a dry swale system with underdrains, an iron-enhanced sand filter, and a stormwater pond, as shown in the schematic to the right. This treatment train was able to significantly reduce pollutant loadings, most significantly by infiltration of a large portion of runoff through the BMPs. This treatment train achieved removal efficiencies of 86 percent for runoff volume, 86 percent for total phosphorous, and 86 percent for total suspended solids.
Stormwater ponds in series approach
The stormwater ponds in series approach consisted of two stormwater ponds located in the BMP Neighborhood of the new development. The Upstream Stormwater Pond replaced the varied BMPs and collects the majority of the drainage area runoff from the upstream new development. The Downstream Stormwater Pond has the same pond design as in the varied BMP approach, collecting the remaining runoff for the new development area. The MIDS schematic for the stormwater ponds in series configuration is shown to the right.
This treatment train, though able to reduce pollutant loadings, did not perform to the standard of the varied BMP approach. While the stormwater ponds in series provided peak flow attenuation and discharge flow rate control, no runoff volume reduction is recognized. The stormwater ponds resulted in 61 percent removal of total phosphorus and 84 percent removal of total suspended solids. Results from the MIDS calculator comparing the varied BMP approach to the ponds-in-series approach are summarized above.
Step 6: Review construction and operations criteria
Each of the BMPs included in these treatment trains have unique criteria for construction and operations. Information regarding construction and operations should be reviewed in detail before design and construction of the BMPs takes place. Links to this information are provided below.
| Infiltration basin | Dry swale | Iron-enhanced sand filter | Stormwater ponds |
|---|---|---|---|
| Construction | Construction | Construction | Construction |
| Maintenance | Maintenance | Maintenance | Maintenance |
Related articles
- Using the treatment train approach to BMP selection
- Scenario for developing a stormwater treatment train for a parking lot
- Scenario for developing a stormwater treatment train for an ultra-urban setting
- Scenario for developing a stormwater treatment train for a site with limited infiltration capacity
- Scenario for developing a stormwater treatment train for a retrofit site
- Scenario for developing a stormwater treatment train for constructed ponds in new development
- Case studies for stormwater treatment trains
This page was last edited on 12 February 2023, at 13:35.
