Difference between revisions of "Recommendations and guidance for utilizing the MPCA Simple Estimator to meet TMDL permit requirements"
m |
|||
| Line 171: | Line 171: | ||
*[[Case studies for monitoring to meet TMDL permit requirements]] | *[[Case studies for monitoring to meet TMDL permit requirements]] | ||
| − | [[ | + | [[Category:Level 3 - Regulatory/Municipal (MS4)/TMDLs]] |
| + | [[Category:Level 2 - Models and modeling/Model applications and examples]] | ||
</noinclude> | </noinclude> | ||
Revision as of 14:50, 4 December 2022

The Simple Estimator is a spreadsheet-based tool used to predict watershed-based loading for total phosphorus (TP) and total suspended solids (TSS), and estimate pollutant removal at water quality best management practices (BMPs). The spreadsheet tool was created by the Minnesota Pollution Control Agency (MPCA) specifically to assist Municipal Separate Storm Sewer System (MS4) permittees in the completion of the Commissioner-approved total maximum daily load (TMDL) Annual Reporting Form (TMDL Form).
Compared to the MIDS Calculator, the MPCA Simple Estimator is simplified in that it lacks a graphical user interface and uses a simplified approach for predicting pollutant removal at modeled BMPs. Download links for the MPCA Simple Estimator are provided below.
Note: information provided in the following subsections does not reiterate or re-present information readily available in model documentation files. Instead, guidance provided in this document provides engineers and planners with recommendations for development of model inputs, provides guidance for interpreting and summarizing model results, provides supplementary information not included in model documentation, and provides examples showing how the Simple Estimator can be used to demonstrate TMDL compliance.
Contents
Applicability to demonstrating WLA compliance
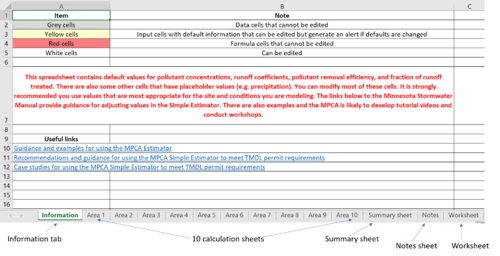
The MPCA Simple Estimator (Estimator) is capable of predicting annual runoff, TSS, and TP loading from a variety of land use types, and pollutant removal for ten (10) BMP types and up to 10 sub-watersheds. The tool is an empirical model which predicts pollutant and runoff removal at BMPs based on design-standard BMP removal rates published in the 2012 International BMP Database and the Minnesota Stormwater Manual.
Calculations may be made for up to 10 subwatersheds. Subwatersheds may represent an area draining to a receiving water, the area draining to a specific grouping of BMPs, or the area draining to a specific BMP. Within a subwatershed, the Estimator allows grouping of BMPs of a given type prior to performing loading and removal calculations. Within the tool, there is a single column for each of the ten (10) BMP types, where the user aggregates and inputs the cumulative tributary land use area to that given BMP type. Although aggregating BMPs in this way limits the number of user-inputs required, it means the tool is not capable of modeling
- routing between BMPs,
- unique removal rates for individual BMPs (that may be undersized, or not otherwise meeting design criteria),
- pollutant removal through BMP in series (i.e., treatment trains), or
- bypass of runoff and pollutant from undersized BMPs.
The Estimator should only be used to evaluate and demonstrate wasteload allocation (WLA) compliance for simplified study areas in which the impact of BMP routing, BMP treatment in series, and bypass from undersized BMPs is minimal. The user should limit grouping of BMPs by using multiple subwatershed worksheets. Additionally, because the Estimator reports results on an annualized basis, the tool is not capable of evaluating compliance for non-annualized WLAs (e.g., WLAs based on the growing season).
In summary, the Estimator is capable of demonstrating compliance to annualized mass based WLAs (e.g., pounds of TSS per year), concentration-based WLAs (e.g., mg/L of TSS), and areal-loading based WLAs (e.g., pounds of TSS per acre per year) for TSS and TP, for simplified study areas where the impact of BMP treatment in series and bypass from undersized BMPs is considered negligible or where multiple subwatershed worksheets can be used to minimize the impact of BMP treatment in series and bypass from undersized BMPs. The Estimator is an empirical model which is not capable of modeling pollutant removal through BMPs in series and bypass from undersized BMPs.
Special Consideration(s):
- The MPCA Simple Estimator reports on an annualized-basis, and is therefore not suitable for evaluating WLA compliance for non-annualized WLAs.
- The Estimator is an empirical model which has limited ability to model pollutant removal through BMPs in series and bypass from undersized BMPs. For this reason, the Estimator should only be used to demonstrate WLA compliance for simplified study areas where the impact of pollutant removal through BMPs in series and bypass from undersized BMPs in considered minimal.
- The Estimator has limited ability to distinguish unique removal rates for individual BMPs that may be undersized or would not otherwise meet BMP design criteria.
Model inputs
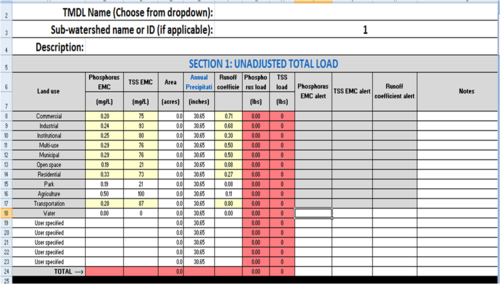
The following subsections outline data sources and special consideration related to model inputs, model setup, and model initialization. The discussion applies to a single subwatershed worksheet. Permittees should limit grouping of BMPs to the extent possible by utilizing multiple subwatershed worksheets.
Note: these subsections do not represent information readily available in model documentation, but instead highlight data sources (e.g., spatial datasets), special consideration, and important notes for engineers and planners to consider while generating model inputs.
Initial runoff and pollutant loading
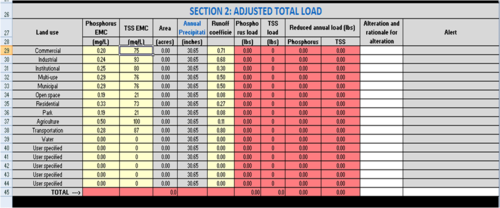
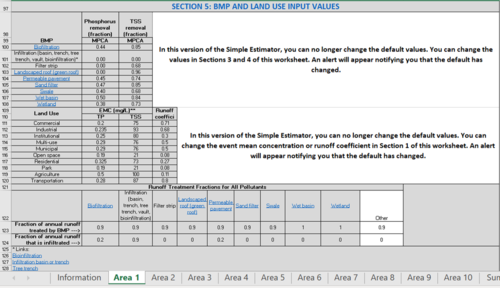
The MPCA Simple Estimator estimates annual runoff and pollutant loading using the Simple Method (Schueler, 1987). The tool requires the user to enter the annual rainfall total depth for the project area, and provides a link to US climate data which can be used to look up average annual precipitation depths for many cities in Minnesota. Unique pollutant event mean concentrations (EMCs) and runoff coefficient (Rv) values are assigned for each of the ten (10) land use types from The National Stormwater Quality Database (NSQD), Version 3.1, Zone 1 (Pitt, 2011). EMCs and Rv values can be edited by the user and should be reviewed by the engineer or designer. Default emc values in version 3.0 of the Estimator are within a range of typical literature EMC values for TP and TSS. When a default value is changed, the Estimator displays an alert notifying the user that the default has been changed.
MPCA Simple Estimator runoff coefficient and pollutant event mean concentration (EMC) values. For additional information, see Event mean concentrations of total and dissolved phosphorus in stormwater runoff, Event mean concentrations of total suspended solids in stormwater runoff, Stormwater runoff coefficients/curve numbers for different land uses.
Link to this table
| Land use | Runoff coefficient (Rv) | TP EMC1 (mg/L) | TSS EMC (mg/L) |
|---|---|---|---|
| Residential | 0.27 | 0.325 | 73 |
| Commercial | 0.71 | 0.20 | 75 |
| Industrial | 0.68 | 0.24 | 93 |
| Institutional | 0.30 | 0.25 | 80 |
| Multi-use | 0.5 | 0.29 | 76 |
| Municipal | 0.5 | 0.29 | 76 |
| Open space | 0.08 | 0.19 | 21 |
| Transportation | 0.8 | 0.28 | 87 |
1Event mean concentration
When possible, it is recommended that site-specific information be used to delineate land use types within the study area (record drawings, zoning data, parcel information, etc.). Many public domain spatial land use databases can be used to review and supplement site-specific land use information, including databases outlined below.
- USGS National Land Cover Database (NLCD) - nationwide coverage
- Metropolitan Council Generalized Land Use - Twin Cities seven-county area coverage
Guidance for adjusting emcs, runoff coefficients, or modeling land use types not included by default in the Estimator are provided at the following links.
- Event mean concentrations of total and dissolved phosphorus in stormwater runoff
- Event mean concentrations for total phosphorus
- Event mean concentrations of total suspended solids in stormwater runoff
- Event mean concentrations for total suspended solids
- Runoff coefficients for different soil groups and slopes
Special Consideration(s):
- Open water area should not be included in area assigned to each land cover type. The Estimator calculates pollutant loading from all areas assigned to each land use type, and will therefore incorrectly calculate pollutant loading from open water area assigned to a given land use type.
Adjusted runoff and pollutant loading
The estimator allows the user to adjust EMC or runoff coefficient for a land use entered in the initial load. The worksheet cells are initially auto-filled to match the cells in the initial load. Only the emc and runoff coefficient may be adjusted by the user. Upon making changes in either emc or runoff coefficient, the estimator calculates pounds reduced or increased as a result of the change.
Adjustments to emc or runoff coefficient are recommended for the following, although there may be other situations where adjustments are appropriate.
- A change in land use. For example, if agricultural land is converted to residential land, the emc and runoff coefficients for residential land use should be entered here.
- Source control practices that reduce the concentration of TSS or TP that will enter downstream BMPs. Examples include street sweeping and enhanced pretreatment.
- Updated information. For example, monitoring may show that emcs differ from the initial values used in calculations. The new emc should be entered in this part of the worksheet.
These adjusted loads will be used to determine pollutant reductions associated with implementation of downstream, permanent structural BMPs (e.g. biofiltration, sand filter, etc.).
BMPs: pollutant loading and routing
The MPCA Simple Estimator includes ten (10) BMP types: biofiltration, infiltration, filter strip, green roof, permeable pavement with underdrains, sand filter, swale, wet pond, stormwater wetland, and “other” (user-defined BMP). Runoff and pollutant loading to a given BMP type is determined by assigning the area (acres) of each of the ten (10) land use types tributary to the BMP type with the subwatershed. The spreadsheet tool provides one (1) column for each BMP type and requires the user to input the cumulative land use-based area to that BMP type. For example, if there are two wet basins in the subwatershed, one with 5 acres of commercial land use and the other with 10 acres of commercial land use, the user would enter that there are 15 acres of commercial land use tributary to wet basins. Because BMPs are grouped in this way, the Estimator does not require any BMP dimensions (e.g., permanent pool volume, infiltration rate, etc.) and assumes that BMPs are sized correctly for the tributary area assigned. This simplified methodology limits the number of user-inputs required and allows for rapid calculation of BMP removal, but grouping BMPs in this way means that the tool is not capable, within a given subwatershed, of modeling
- routing between BMPs,
- pollutant removal through BMP in series (i.e., treatment trains),
- identifying and/or distinguishing unique removal rates for individual BMPs that may be undersized or would not otherwise meet BMP design criteria,
- BMPs with specific designs that decrease or improve pollutant removal (e.g. iron enhanced treatments), or
- bypass of runoff and pollutant from undersized BMPs.
If any of the situations listed above exist in the subwatershed, the engineer or designer must take special precautions to ensure that the Estimator does not over-estimate or incorrectly calculate pollutant removal. The following steps and strategies can be used to avoid pollutant removal calculation errors associated with BMP routing and undersized BMPs.
- Utilize separate worksheets in the spreadsheet to minimize or avoid these issues.
- If the engineer or designer determines a BMP is undersized for the contributing area, assign only the area for which the BMP is correctly sized to the BMP.
- For BMPs in series, only assign the directly contributing area to each BMP (i.e., do not assign the cumulative tributary area including area treated by upstream BMPs).
Special Consideration(s):
- The MPCA Simple Estimator is not capable of modeling BMP routing, bypass from undersized BMPs, or BMP removal from BMPs in series (i.e., treatment trains). Steps to avoid BMP removal calculation errors are outlined above.
BMPs: pollutant removal
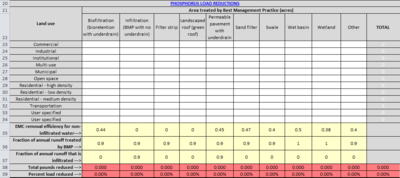
The MPCA Simple Estimator is an empirically based model which predicts pollutant and runoff removal at BMPs based on assumptions related to (a) EMC removal efficiency for non-infiltrated water, (b) fraction of annual runoff treated by the BMP, and (c) fraction of annual runoff that is infiltrated. Below is a summary of each of these parameters and how each relate to pollutant removal calculations.
- EMC removal efficiency for non-infiltrated water: EMC removal rate related to processes of sedimentation and filtration published in the 2012 International BMP Database and the Minnesota Stormwater Manual.
- Fraction of annual runoff treated by BMP: The fraction of runoff and pollutant which is treated by the BMP (e.g., if the assumed fraction treated is 90%, 10% of runoff and pollutant loading is assumed to bypass the BMP without receiving treatment).
- Fraction of annual runoff that is infiltrated: Fraction of the treated portion of runoff (see above) which is infiltrated by the BMP. Pollutants associated with infiltrated volume are assumed to be removed.
Default parameter values for each BMP are shown in the following table. In general, default values agree with or were developed from information published in the MPCA Stormwater Manual. Designers and engineers should review and, if needed, update parameter values to reflect site-specific conditions and BMP design. For BMPs not included in the MPCA Simple Estimator, BMP removal parameters can be manually assigned for the “other” BMP type, which is included in the tool to allow users to model unique BMP types. Parameter values applied for user-defined BMPs should be developed from site-specific information, BMP monitoring data and/or published literature values.
MPCA Simple Estimator default BMP parameter assumptions
Link to this table
| Percentage of annual runoff ... | EMC removal efficiency for non-infiltrated water | |||
|---|---|---|---|---|
| BMP type | Treated by BMP | Infiltrated | TP | TSS |
| Biofiltration | 90 | 20 | 441 | 85 |
| Infiltration | 90 | 90 | 0 | 0 |
| Filter strip | 90 | 0 | 0 | 68 |
| Green roof | 90 | 0 | 0 | 96 |
| Permeable pavement | 90 | 0 | 45 | 74 |
| Sand filter | 90 | 0 | 47 | 85 |
| Swale | 90 | 0 | 40 | 68 |
| Wet basin | 100 | 0 | 50 | 84 |
| Wetland | 100 | 0 | 38 | 73 |
| Other | User defined | |||
1Assumes that an engineered media mix is used that does not leach phosphorus (e.g. Mix C or D, or media tested and total phosphorus content is 30 mg-P/kg-soil or less.
Model outputs
Within each subwatershed worksheet, the Estimator provides annual pollutant loading and removal summaries for individual BMP types and on a subwatershed basis. Load reduction for individual BMP types is presented in columns B through K within the respective pollutant load reduction tables, and total reductions are summarized in column L.
The following subsections provide guidance on how to interpret and QAQC model outputs.
Interpreting model results
A separate worksheet called "Summary sheet" provides results for the entire project area (i.e. all sub-watersheds combined). This worksheet provides the following information.
- Initial and final loads, in pounds, of TP and TSS for each subwatershed and for the entire project area
- Reduction in TP and TSS loads for each subwatershed and for the project area, expressed in both pounds and percent reduced from the initial load.
- Initial and final loading rates, in lb/ac/yr, for TP and TSS, by subwatershed and for the project area.
- Summary information by BMP type, including acres treated by the BMP type and pounds reduced from the BMP type
Outflow loading concentration (e.g. mg/L of phosphorus) is a WLA metric required by some TSS and TP TMDLs. Calculating inflow and outflow loading pollutant concentration in the Estimator requires additional calculations outside of the tool, as the spreadsheet does not track and display runoff volumes generated or removed by BMPs. If required by a TMDL, inflow and outflow pollutant loading concentration can be calculated as follows:
- Calculate runoff from land use type (acre-feet): [Area, acres] x [Annual Rainfall, inches] x [Runoff Coefficient] / 12;
- Sum the runoff for all land use types = Total Runoff* (acre-feet);
- Calculate the runoff loading to each infiltration BMP (i.e., BMPs with non-zero (0) “fraction of annual runoff that is infiltrated”) from each land use type: [Area, acres to BMP] x [Annual Rainfall, inches] x [Runoff Coefficient] / 12;
- Sum the total runoff to the BMP = BMP Inflow* (acre-feet);
- Calculate runoff removal at each infiltration BMP: [BMP Inflow*] x [Fraction of Annual Runoff that is Infiltrated] = BMP Infiltration (acre-feet);
- Sum all BMP Infiltration values = Total Infiltration*
- Calculate annual outflow volume: [Total Outflow*] = [Total Runoff*] – [Total Infiltration*];
- Calculate inflow concentration = [Watershed Loading* (see Table 30)] / [Total Runoff*] x [CF*]; [CF*] = conversion factor to convert to mg/L (ppm) = 0.367733624.
- Calculate outflow concentration = [Outflow Loading* (see Table 30)] / [Total Outflow*] x [CF*].
Special Consideration(s):
- Calculating pollutant concentration values will require calculation of runoff volume and reduction outside of the MPCA Simple Estimator, as the tool does not display runoff concentrations.
QAQC of model results
The engineer or designer should perform a thorough review of all model inputs and outputs. Model inputs should be generated using best available datasets, including record drawings, development data, bathymetric surveys, and best-available spatial land use, land cover, and soil databases. Upon model completion, results should be reviewed to ensure BMPs were categorized and/or combined correctly, subwatersheds were combined correctly, and that pollutant removal and areal loading results are within typical ranges based on BMP and land use type, respectively. A general model result QAQC list and description of outputs to review is provided below.
General MPCA Simple Estimator result QAQC list
Link to this table
| QAQC / Review item | Related MIDS Calculator Output |
|---|---|
| Confirm total watershed area is correct | Review land use-based area assigned in the "total load" table |
| Confirm annual precipitation totals are correct | Review annual rainfall values in column G and confirm all are the same value |
| Review watershed pollutant concentrations | Compare watershed areal loading values in the "total load" table to literature values in Table 9 |
| Review watershed routing to BMPs | Review land use-based area assigned to each BMP type |
| Confirm only the directly-contributing watershed area is applied for each BMP | The area assigned to a given BMP should be only the directly-contributing watershed area and should NOT include area tributary to other BMPs upstream |
| Review TSS/TP removal rates | Compare pollutant removal values to literature values. Note: percent load reduction shown for each BMP type is calculated based on the total watershed loading |
| Review BMP sizing recommendations and review contributing watershed area | Bypass from undersized BMPs is not calculated. For this reason, only the area for which the BMP is correctly-sized should be modeled to the BMP (the remainder should be modeled as untreated). |
Related pages
- Summary of TMDL requirements in stormwater permits
- Forms, guidance, and resources for completing the TMDL annual report form
- Overview of models used to meet MS4 TMDL permit requirements
- Recommendations and guidance for utilizing P8 to meet TMDL permit requirements
- Case study for using P8 to meet TMDL permit requirements
- Recommendations and guidance for utilizing WINSLAMM to meet TMDL permit requirements
- Case study for using WINSLAMM to meet TMDL permit requirements
- Recommendations and guidance for utilizing the MIDS calculator to meet TMDL permit requirements
- MIDS calculator
- Case study for using the MIDS calculator to meet TMDL permit requirements
- Recommendations and guidance for utilizing the MPCA Simple Estimator to meet TMDL permit requirements
- MPCA Simple Estimator
- Case study for using the MPCA Simple Estimator to meet TMDL permit requirements
- Default TSS and TP loads for different land use scenarios using the MPCA Simple Estimator
- Recommendations and guidance for utilizing monitoring to meet TMDL permit requirements
- Case studies for monitoring to meet TMDL permit requirements


