| TSS | TP | PP | DP | TN | Metals2 | Bacteria3 | Hydrocarbons |
|---|---|---|---|---|---|---|---|
| 35/201 | 0 | 0 | 0 | 154 | 35 | 35 | ND5 |
| TSS=total suspended solids; TP=total phosphorus; PP=particulate phosphorus; DP=dissolved phosphorus; TN=total nitrogen | |||||||
| 135 percent credit if a check dam is employed; 20 percent credit if no check dam is employed; 2 Value represents the median removal for total Cd, Cr, Cu, Pb, and Zn using data from the International Stormwater BMP database (2016 summaries); removal for dissolved metal is 0; 3 Data from the International Stormwater BMP database, 2016, for fecal coliform bacteria; 4 From the International Stormwater BMP database, 2016, for total nitrogen; 5 No data found. | |||||||
Warning: Models are often selected to calculate credits. The model selected depends on your objectives. For compliance with the Construction Stormwater permit, the model must be based on the assumption that an instantaneous volume is captured by the BMP. For more information on using models to calculate credits see Methods and resources for calculating credits.
Green Infrastructure: Swales can be an important tool for retention and detention of stormwater runoff. Depending on design and construction, swales may provide additional benefits, including cleaner air, carbon sequestration, improved biological habitat, and aesthetic value. See the section Green Stormwater Infrastructure (GSI) and sustainable stormwater management.
Credit refers to the quantity of stormwater or pollutant reduction achieved either by an individual best management practice (BMP) or cumulatively with multiple BMPs. Stormwater credits are a tool for local stormwater authorities who are interested in
- providing incentives to site developers to encourage the preservation of natural areas and the reduction of the volume of stormwater runoff being conveyed to a best management practice (BMP);
- complying with permit requirements, including antidegradation (see Construction permit; Municipal (MS4) permit);
- meeting the MIDS performance goal; or
- meeting or complying with water quality objectives, including total maximum daily load (TMDL) wasteload allocations (WLAs).
This page provides a discussion of how wet swales can achieve stormwater credits.
Contents
Overview
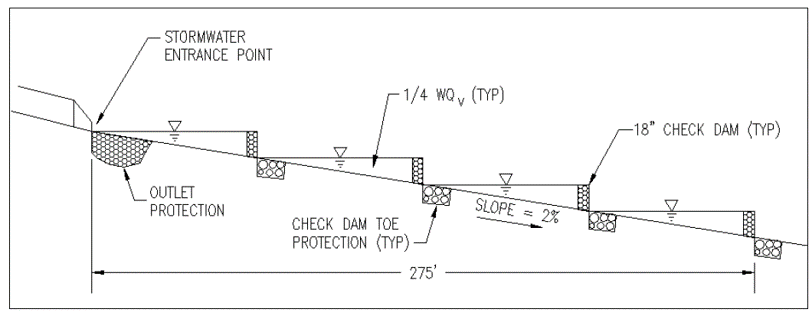
A wet swale acts as a very long and linear shallow biofiltration or linear stormwater wetland system. Wet swales do not provide volume reduction and have limited treatment capability. Incorporation of check dams into the design allows treatment of a portion or all of the Water Quality Volume within a series of cells created by the check dams. Wet swales planted with emergent wetland plant species provide improved pollutant removal. Wet swales may be used as pretreatment practices. Wet swales are commonly used for drainage areas less than 5 acres in size.
Pollutant Removal Mechanisms
Wet swales without check dams primarily remove pollutants through filtration during conveyance of stormwater runoff. Wet swales do not achieve significant volume reduction. Check dams may be incorporated into wet swale design to enhance settling and filtration of solids.
Location in the Treatment Train
Wet swales provide limited water quality treatment and no volume control and are not recommended practices unless options for other BMPs are limited. Wet swales do however, provide additional Green infrastructure benefits because they are vegetated.
Wet swales are designed primarily as in-line systems for stormwater quality and typically are used in conjunction with other structural controls in stormwater treatment trains. Wet swales may be used at various locations within a treatment train] and can be used for pretreatment, conveyance, and/or primary treatment.
Methodology for calculating credits
This section describes the basic concepts and equations used to calculate credits for Total Suspended Solids (TSS). For specific tools and methods that can be used to calculate credits see Methods and resources for calculating credits.
Wet swale practices generate credits for TSS. Wet swale practices are moderately effective at reducing concentrations of metals. They are somewhat effective at removing bacteria. This article does not provide information on calculating credits for pollutants other than TSS, but references are provided that may be useful for calculating credits for other pollutants.
Assumptions and Approach
In developing the credit calculations, it is assumed the swale is properly designed, constructed, and maintained in accordance with the Minnesota Stormwater Manual. If any of these assumptions is not valid, the BMP may not qualify for credits or credits should be reduced based on reduced ability of the BMP to achieve volume or pollutant reductions. For guidance on design, construction, and maintenance, see the appropriate article within the Manual.
Warning: Pretreatment is required for all filtration and infiltration practices
Unlike other BMPs such as bioretention and permeable pavement, credits for swales are calculated in two ways. First, if check dams are incorporated into the design, the water quality volume (VWQ) is assumed to be delivered as an instantaneous volume to the BMP and stored as water ponded behind the check dam, above the soil or filter media, and below the overflow point of the check dam. VWQ can vary depending on the stormwater management objective(s). For construction stormwater, VWQ is 1 inch times new impervious surface area. For MIDS, the VWQ is 1.1 inches times impervious surface area.
Second, if check dams are not incorporated into the swale, water will be filtered as it is conveyed along the swale. Some settling also occurs as the water is conveyed. The extent of filtration is a function of the channel roughness, including vegetation effects, and the slope of the swale, which affects the velocity of the water and thus settling.
Total suspended solids
The water quality volume (Vwq) achieved behind each check dam (instantaneous volume), in cubic feet, is given by
$^V_{wq} = 1728 h^2 * (h * H + B_w)]/(2S) ^$
where:
h = check dam height (inches);
H = horizontal component of the swale side slope (1 vertical : H horizontal)(inches);
S = slope (unitless); and
Bw = channel bottom width (inches).
Add the Vwq for each check dam together to obtain the cumulative water quality volume for the swale.
TSS reduction credits correspond with the volume captured by swale check dams and is given by
$^M_{TSS} = M_{TSS_f} ^$
where:
MTSS = TSS removal (pounds); and
MTSS_f = TSS removal from filtered water (pounds).
The event-based mass of pollutant removed through filtration, in pounds, is given by
$^ M_{TSS_f} = 0.0000624 V_{total} EMC_{TSS} R_{TSS} ^$
where:
Vtotal is the total volume of water captured by the BMP (cubic feet);
EMCTSS is the event mean concentration (mg/L); and
RTSS is the TSS pollutant removal percentage for filtered runoff.
The Stormwater Manual provides a recommended value for RTSS of 0.35 (35 percent) removal for filtered water. Alternate justified percentages for TSS removal can be used if proven to be applicable to the BMP design.
The above calculations may be applied on an event or annual basis and are given by
$^ M_{TSS_f} = 2.72\ F\ V_{F_{annual}}\ EMC_{TSS}\ R_{TSS}^$
where:
F is the fraction of annual volume filtered through the BMP; and
Vannual is the annual volume treated by the BMP, in acre-feet.
Water not captured by a check dam but conveyed in the swale are assigned a removal value of 0.20 (20 percent).
Total phosphorus
Wet swales do not receive credit for phosphorus removal.
Other pollutants
According to the International BMP Database, studies have shown wet swales are somewhat effective at reducing concentrations of bacteria, metals, and nitrogen. This database provides an overview of BMP performance in relation to various pollutant categories and constituents that were monitored in BMP studies within the database. The report notes that effectiveness and range of unit treatment processes can vary greatly depending on BMP design and location. The following table shows a list of the constituents and associated pollutant category for the monitored “media filters” data. The constituents shown all had data representing decreases in effluent pollutant loads for the median of the data points and the 95% confidence interval about the median.
| Pollutant Category | Constituent |
Treatment Capabilities (Low = < 30%; Medium = 30-65%; High = 65 -100%) |
|---|---|---|
| Metals1 | Cd, Pb, Zn | Medium |
| Cu, Cr | Low | |
| Nutrients | Total Nitrogen, TKN | Low |
| Bacteria | Fecal Coliform, E. coli | Medium |
| 1Results are for total metals only | ||
Related articles
- Methods and resources for calculating credits
- Wet swales
- Terminology for swales
- Overview for wet swale (wetland channel)
- Types of filtration
- Design criteria for wet swale (wetland channel)
- Construction specifications for wet swale (wetland channel)
- Operation and maintenance of wet swale (wetland channel)
- Assessing the performance of wet swale (wetland channel)
- Plants for swales
- Check dams for stormwater swales
- Cost considerations
- External resources for wet swale (wetland channel)
- Requirements, recommendations and information for using wet swale in the MIDS calculator
- Requirements, recommendations and information for using swale side slope as a BMP in the MIDS calculator