This page is under construction.
| Overview of the MPCA Simple Estimator |
|---|
|
The MPCA Simple estimator is an Excel-based tool that utilizes the Simple Method to estimate total suspended solid and/or total phosphorus loads and load reductions associated with implementation of best management practices (BMPs). The spreadsheet includes the following features.
|
Contents
- Example 1: Using the MPCA Estimator with multiple subwatersheds
- Example 2: treatment trains, non-structural practices, and other structural BMPs
- Related pages
Example 1: Using the MPCA Estimator with multiple subwatersheds
This example utilizes a site with three subwatersheds and proceeds through a series of implemented practices. To access the spreadsheet used for this example, click here File:MPCA simple estimator version 3 subwatershed example.xlsx
Step 1. Unadjusted load calculation and entering data for land uses
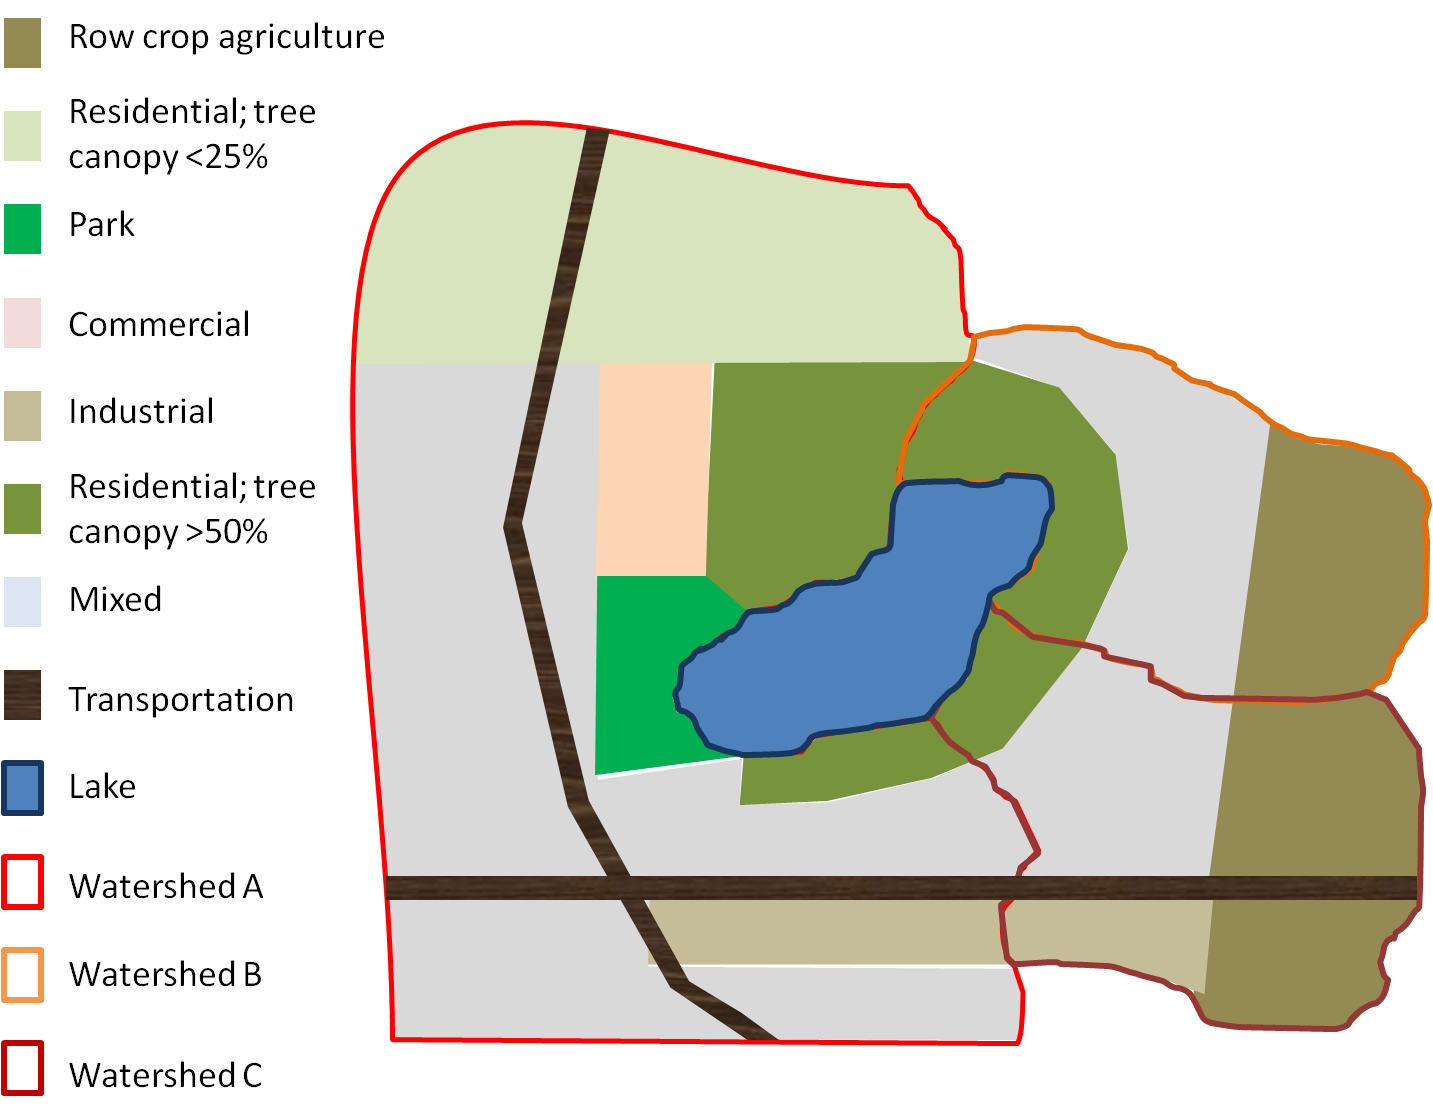
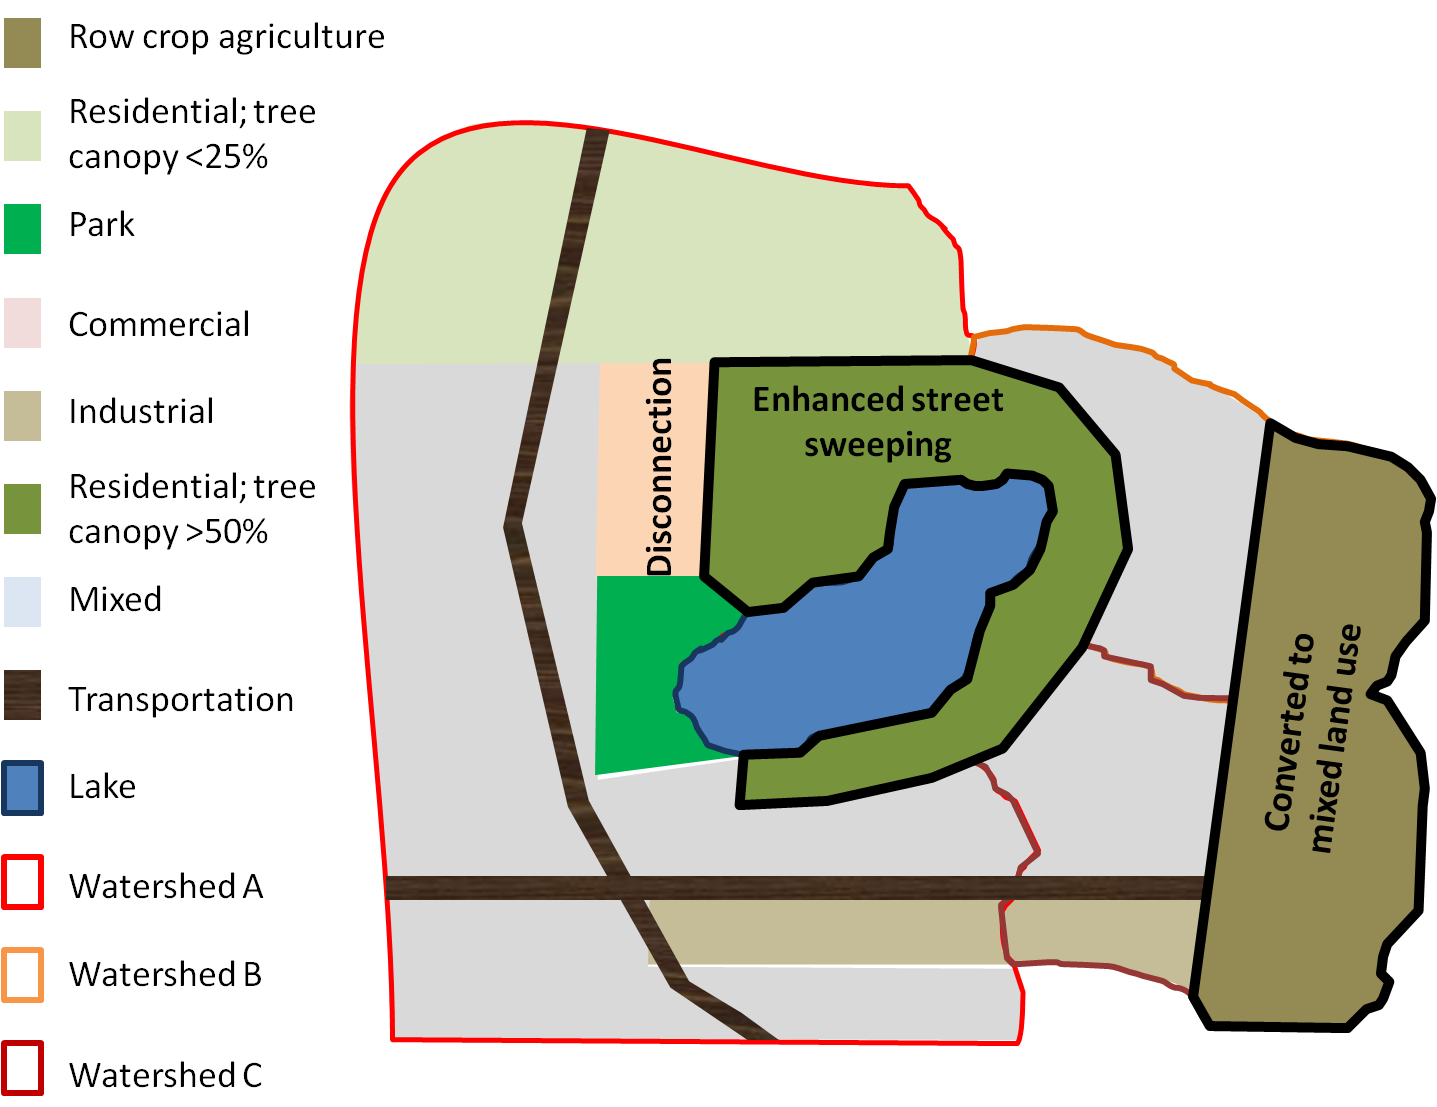
The adjacent schematic is used for this example and will be modified as adjustments are made and BMPs added. The entire project area consists of three subwatersheds. Land uses within the project area include the following.
- Residential with <25% tree canopy coverage
- Residential with >50% tree canopy coverage
- Industrial
- Commercial
- Park
- Transportation
- Mixed (multi-use)
- Agricultural
The entire area drains to a lake. The goal is to reduce phosphorus loading to the lake by 30 percent.
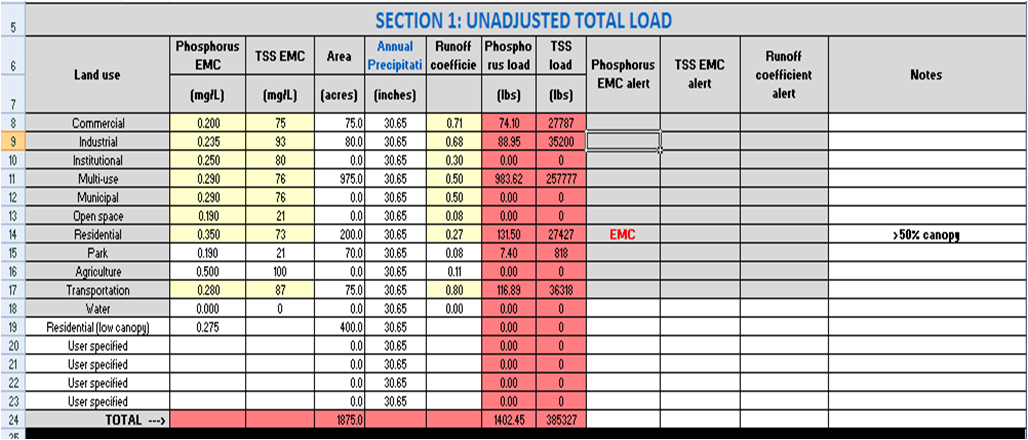
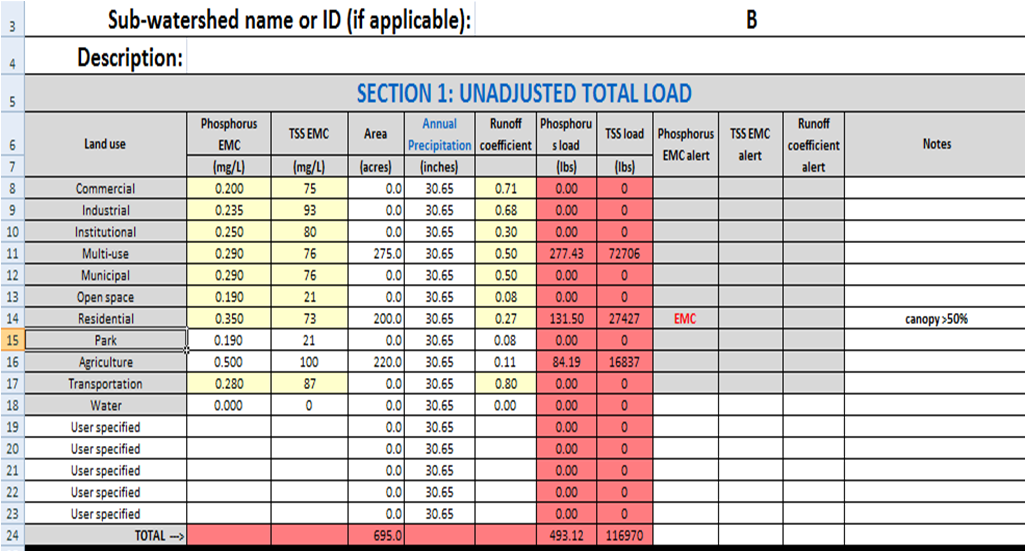
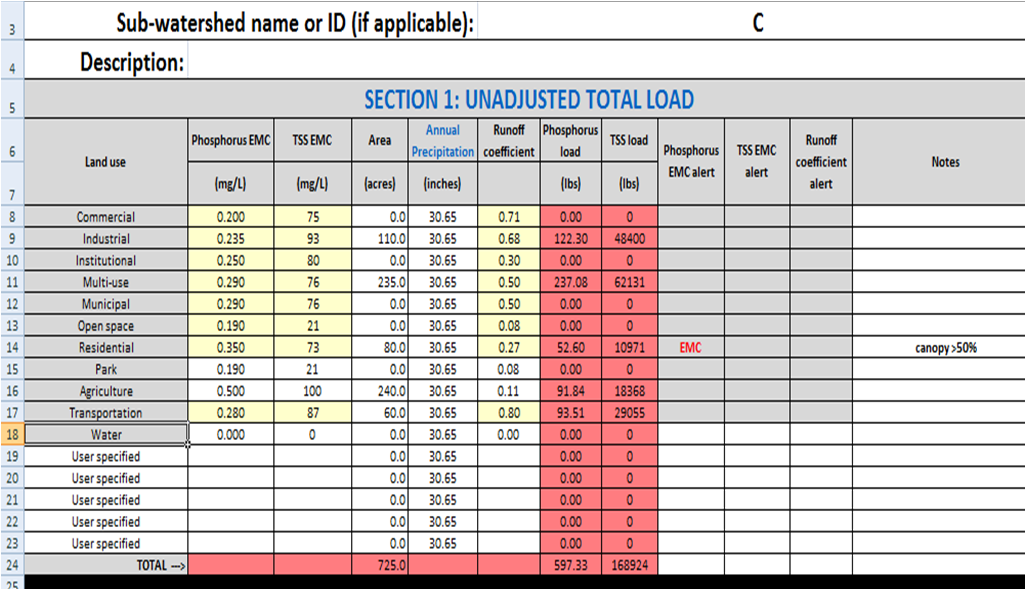
In this first step, we enter acreages for each of the three subwatersheds. These are shown in the adjacent image gallery. To account for the two different residential areas in subwatershed A, we change the default emc for residential to 0.350 mg/L for the high canopy area and add a residential land use with an emc of 0.275 for the low canopy area. For subwatersheds B and C, we change the default residential value to 0.35 mg/L to account for higher phosphorus inputs from trees in the high canopy areas. Alternatively, we could have made these adjustments for residential areas in the second section of the three worksheets (Adjusted loads). The total phosphorus load to the lake from all three watersheds is 2699.54 pounds. With a phosphorus reduction goal of 30 percent, this requires a 809.86 pound reduction in phosphorus loading.
Simple Estimator screen shots for unadjusted loads. Click on an image for enlarged view.
Step 2. Calculating adjusted loads
Actions implemented and accounted for in calculating adjusted loads. The implemented actions include enhanced street sweeping in the residential area with >50% tree canopy, an impervious disconnection program in the commercial area of subwatershed A, and conversion of agricultural land to mixed land use.
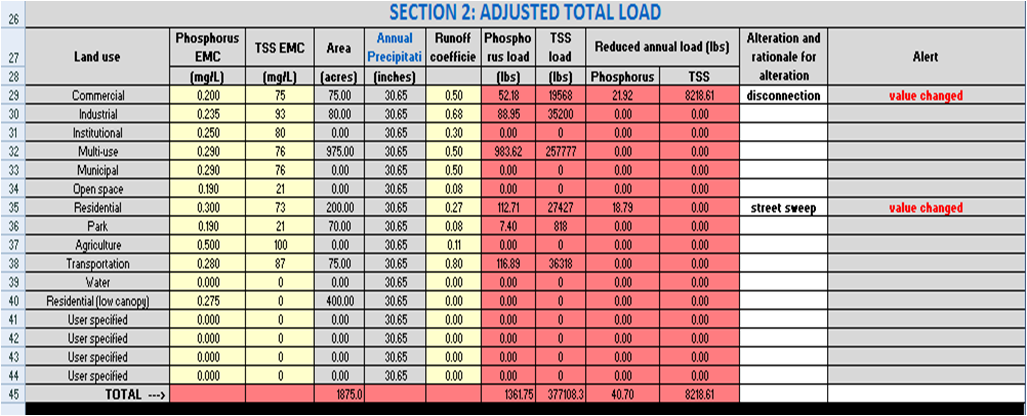
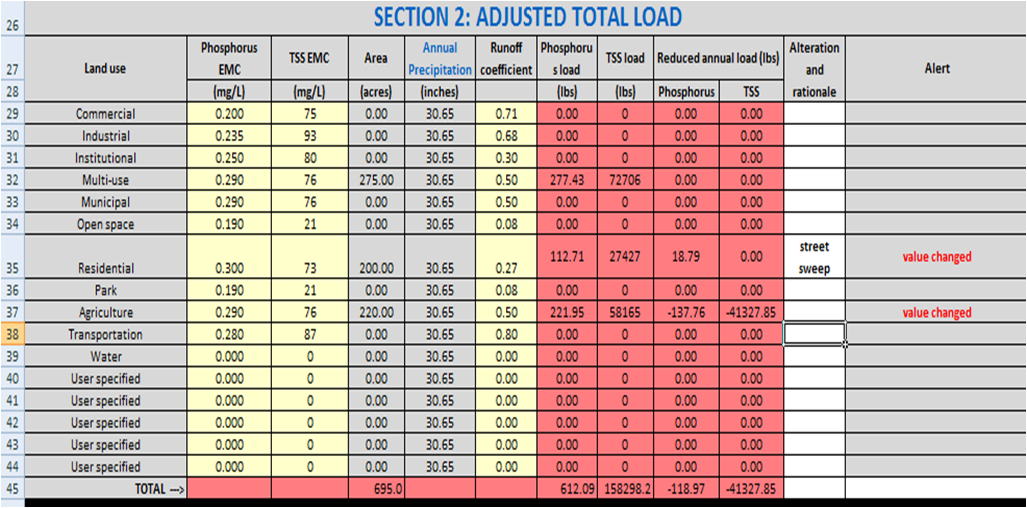
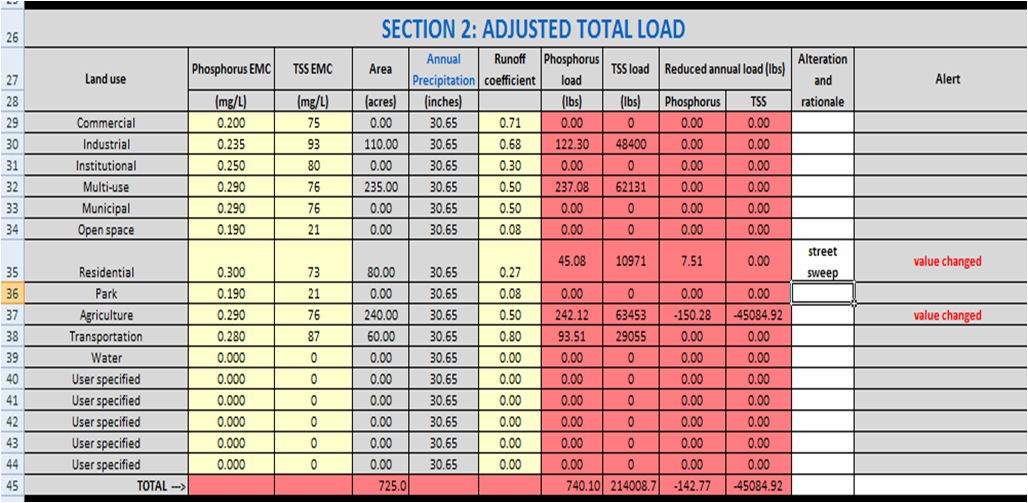
Section 2 of each calculation worksheet allows the user to enter data that results in adjustments to the total load. In this example, the following actions were implemented (see adjacent image).
- In the residential areas with >50% tree canopy coverage, an enhanced street sweeping program was implemented. This consisted of street sweeping at the time of fall leaf drop, rather than the once-a-fall sweeping program previously implemented. Measurements of street sweeping material collected during this time indicate this effort reduced annual loading by about 17 percent. Since the Estimator does not allow direct changes in loading, we adjusted the emc downward until we achieved a 17 percent reduction in loading. To accomplish this, we adjusted the emc from 0.35 mg/L to 0.30 mg/L. This resulted in a phosphorus decrease of 18.79 pounds in subwatershed A, 18.79 pounds in subwatershed B, and 7.51 pounds in Subwatersdhed C, for a total reduction of 45.09 pounds.
- In the commercial area of subwatershed A, a rooftop and parking lot disconnection effort was implemented. Runoff from these areas was diverted to pervious surfaces. The runoff coefficient was adjusted downward from 0.71 to 0.50 based on the calculated decrease in connected impervious surface. This resulted in a phosphorus decrease of 21.91 pounds.
- The agricultural areas in subwatersheds B and C were converted to mixed land use. We changed the emc and runoff coefficients from agricultural land use to the default values for mixed land use. Phosphorus loads increased by 137.76 pounds in subwatershed B and 150.28 pounds in subwatershed C. BMPs were implemented during the land use conversion, but these calculations are made in Section 3.
After these adjustments, the phosphorus load increased by 221.04 pounds, assuming no further BMPs were implemented. The adjacent photo gallery provides screen shots for each of the three subwatersheds.
Simple Estimator screen shots for adjusted loads. Click on an image for enlarged view.
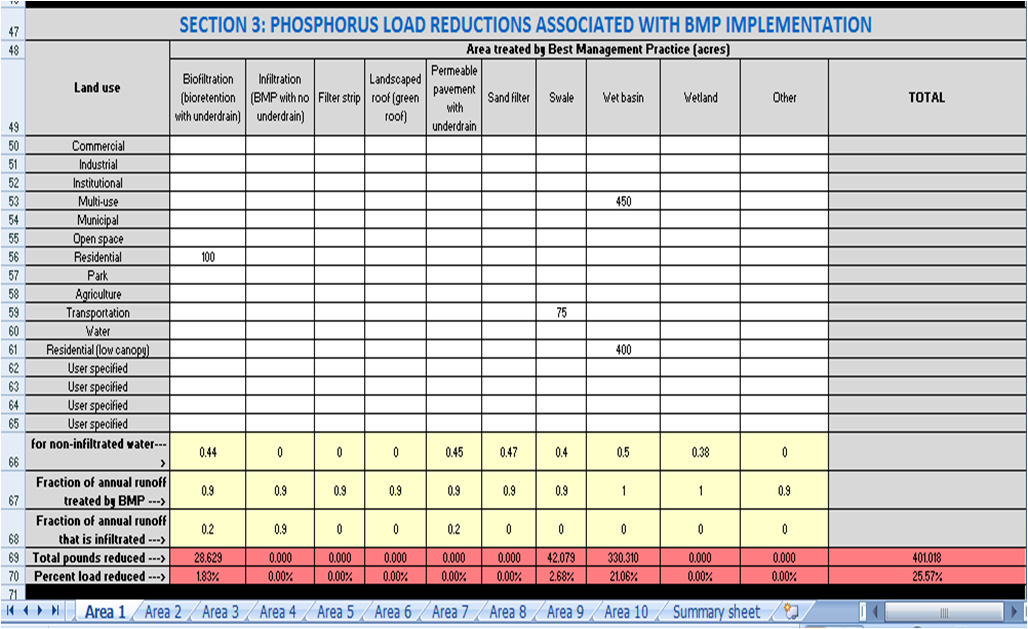
Step 3. Entering structural best management practices (BMPs)
In this section, structural BMPs are entered for each of the subwatersheds as shown on the schematic below where BMPs are implemented, except for swales associated with transportation corridors. A summary of the implemented practices is provided below.
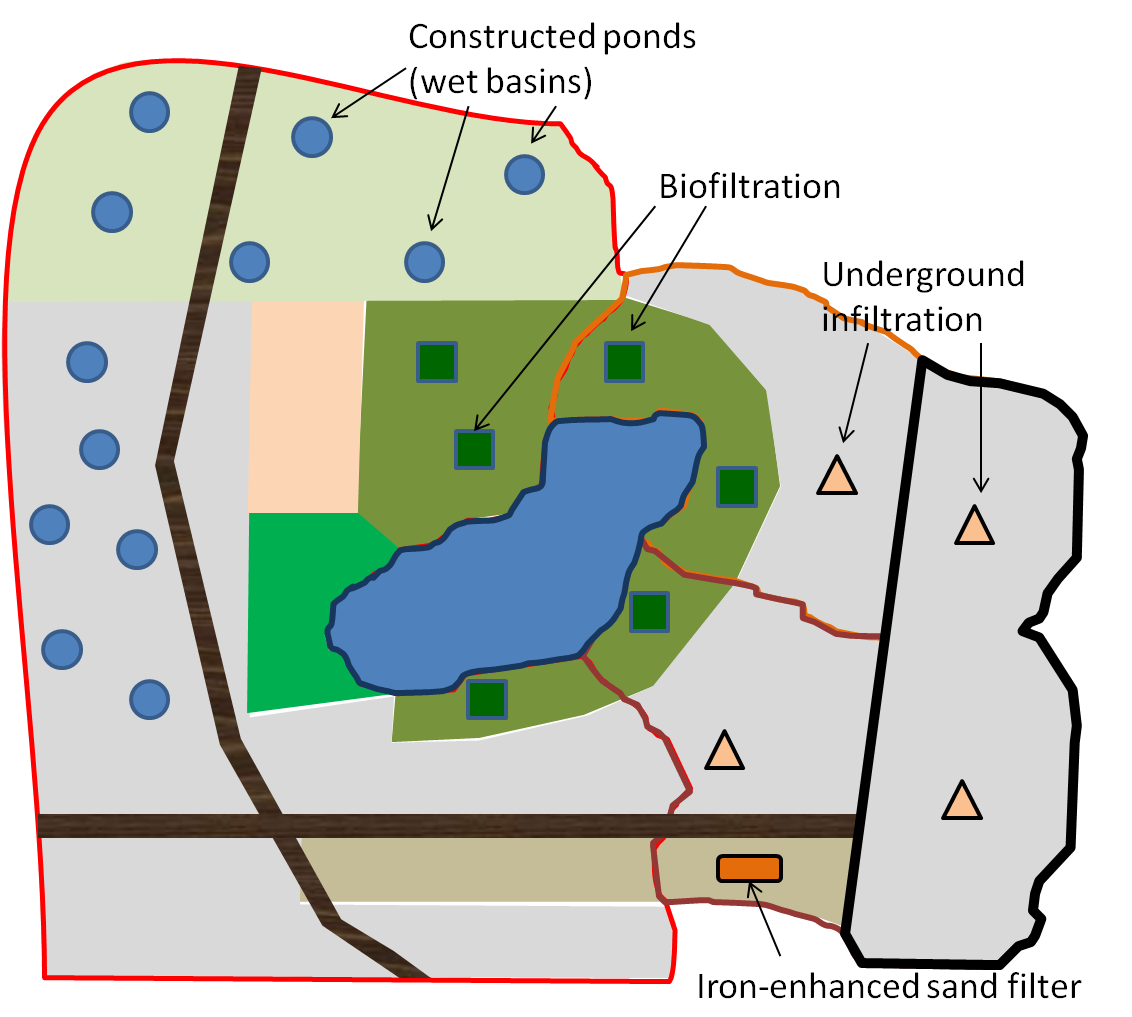
- Subwatershed A. This subwatershed consists primarily of hydrologic soil group (HSG) C and D soils, making infiltration impractical.
- Stormwater runoff in much of the area is diverted to wet pond (constructed ponds). A total of 450 acres of mixed land use (multi-use) is treated by ponds and 400 acres of low canopy residential area is treated by ponds. This results in a phosphorus reduction of 330.31 pounds.
- Biofiltration practices (rain gardens, with an underdrain) are implemented for 100 acres of the residential, high canopy area, resulting in a phosphorus reduction of 28.63 pounds
- Swales treat 75 acres of runoff from transportation areas, resulting in a reduction of 42.08 pounds of phosphorus
The total phosphorus reduction from these BMPs is 401.02 pounds
- Subwatershed B. This subwatershed includes HSG A, B, and C soils. Infiltration is therefore feasible in some of the area.
- Underground infiltration is utilized for 290 acres in the mixed land use areas, including the entire area where agricultural land was converted to mixed land use. This results in a reduction of 263.31 pounds of phosphorus.
- Biofiltration is utilized for 100 acres of residential land, resulting in a reduction of 28.63 pounds.
The total phosphorus reduction in this subwatershed is 291.94 pounds.
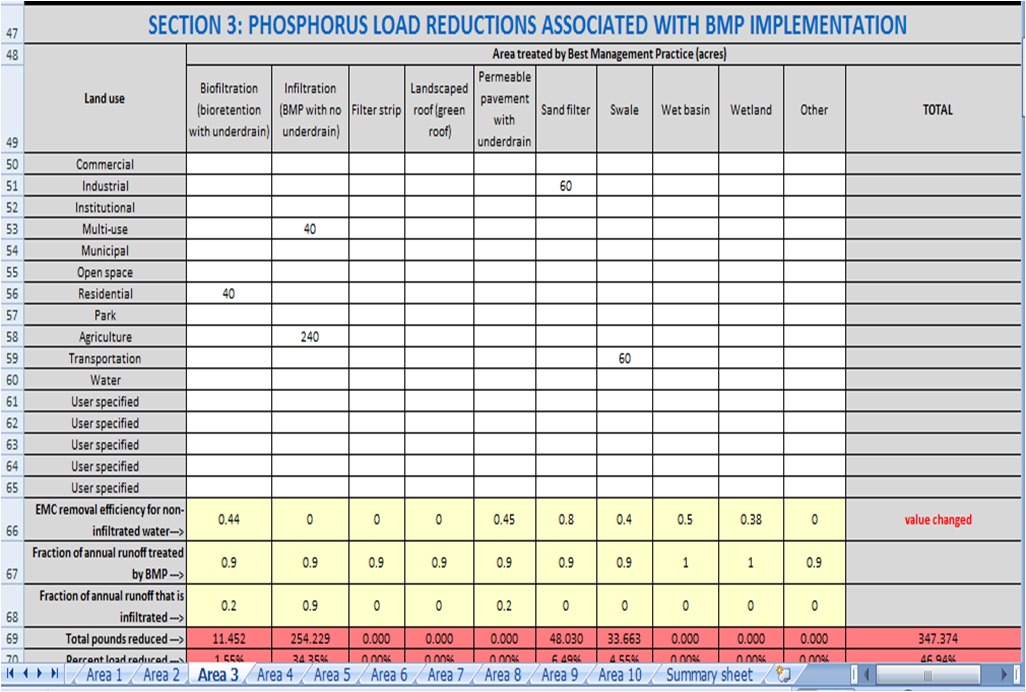
- Subwatershed C. This subwatershed includes HSG A, B, andC soils. Infiltration is therefore feasible in some of the area.
- Underground infiltration is utilized for 280 acres in the mixed land use areas, including the entire area where agricultural land was converted to mixed land use. This results in a reduction of 254.23 pounds of phosphorus.
- Biofiltration is utilized for 40 acres of residential land, resulting in a reduction of 11.45 pounds.
- Swales are utilized in transportation corridors, treating 60 acres for a phosphorus reduction of 33.66 pounds
- Iron-enhanced sand filters treat 60 acres of runoff in the industrial area. Note the phosphorus removal efficiency of this practice was change from 0.47 to 0.80 due to the use of iron in the treatment. The total phosphorus reduction for this practice is 48.03 pounds.
The total phosphorus reduction in this subwatershed is 347.37 pounds.
The total phosphorus reduction for the three subwatersheds is 819.29 pounds, which meets the target of 809.86 pounds. Note this included increased loads calculated in section 2 (adjusted loads) and decreased loads associated with BMP implementation. The adjacent image gallery provides screenshots from the Estimator for the three subwatersheds.
Simple Estimator screen shots for implementation of structural BMPs. Click on an image for enlarged view.

This example illustrates the following.
- Infiltration is a very effective practice for removing phosphorus
- Biofiltration in residential areas is only somewhat effective due to the low runoff coefficient; i.e. the practice does not treat a lot of runoff. For example, swales in subwatershed A remove more phosphorus even though swales are not particularly effective at removing phosphorus and less area is treated compared to residential land use. The higher removal is associated with the higher runoff coefficient for transportation, resulting in greater runoff volumes being treated.
- We assume the engineered media mixes for biofiltration do not leach phosphorus. These would be Mixes C or D, or use of some material in the mix that does not leach phosphorus, such as coir or biochar.
- Iron enhanced treatment is an effective practice if large volumes of water can be treated in this manner. One concern with sand filters, however, is that large systems are needed to treat large runoff volumes.
- Additional practices, such impervious disconnection and use of permeable pavement, could further reduce phosphorus loading. These are practices that can be used at the individual homeowner scale.
NOTE: In Section 3, a total reduction of 1080.4 pounds is achieved with BMP implementation. However, phosphorus loading would increase with the land use conversion if no BMPs were implemented. This explains why the load reduction in Section 3 is greater than the net reduction of 819.29 pounds.
Review Summary Sheet
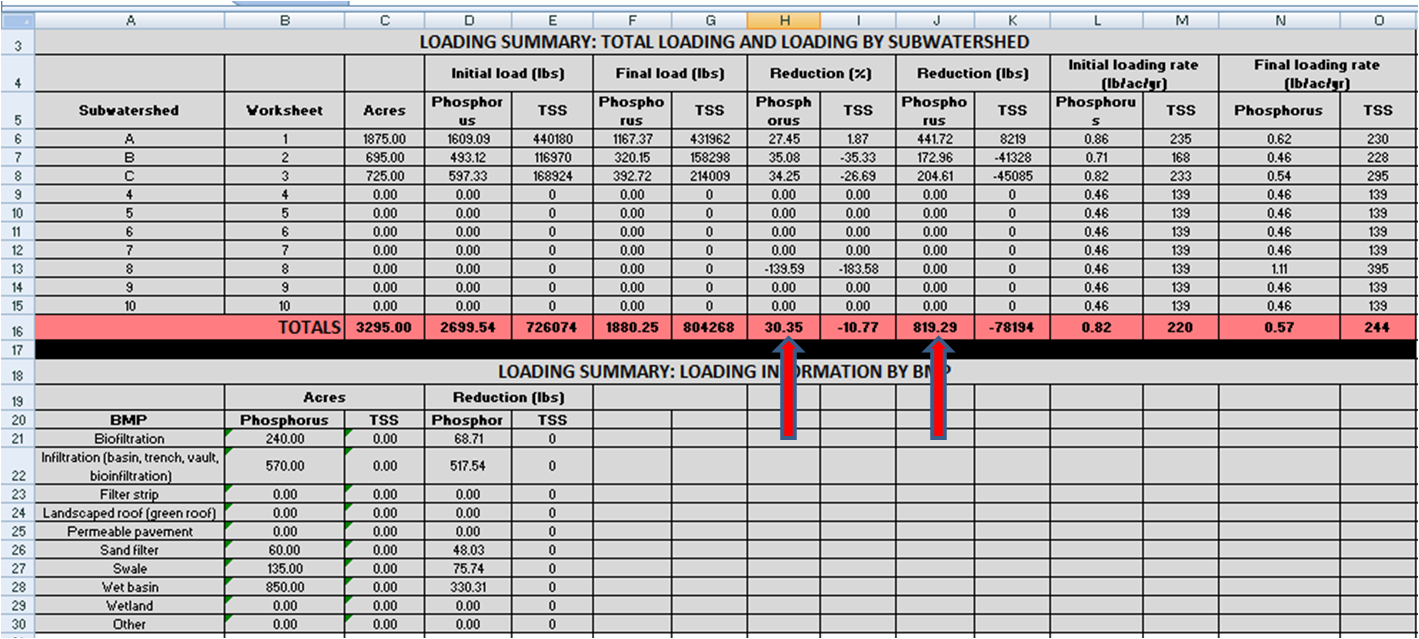
The adjacent image provides a screen shot of the Summary worksheet for this example. Note the following in the image.
- Data are shown for each subwatershed and for the entire site
- Initial and final loads are shown, as well as the percent reduction achieved
- Loading rate, in pounds per acre, are included (both initial and final)
- Cumulative load reductions for the different BMPs are illustrated
Note that we did not address total suspended solids in our calculations. The summary suggests TSS loads increased, but this is because we ignored calculations for TSS as it was not a pollutant of concern. To accurately reflect TSS, we would enter the BMP data for each subwatershed in Section 4 of each worksheet in the Estimator.
Example 2: treatment trains, non-structural practices, and other structural BMPs
In this example we'll demonstrate how to use the Estimator for treatment trains, non-structural practices, and structural BMPs that are not included as defaults in the Estimator.
Click here to download Version 3 of the workbook associated with this example.
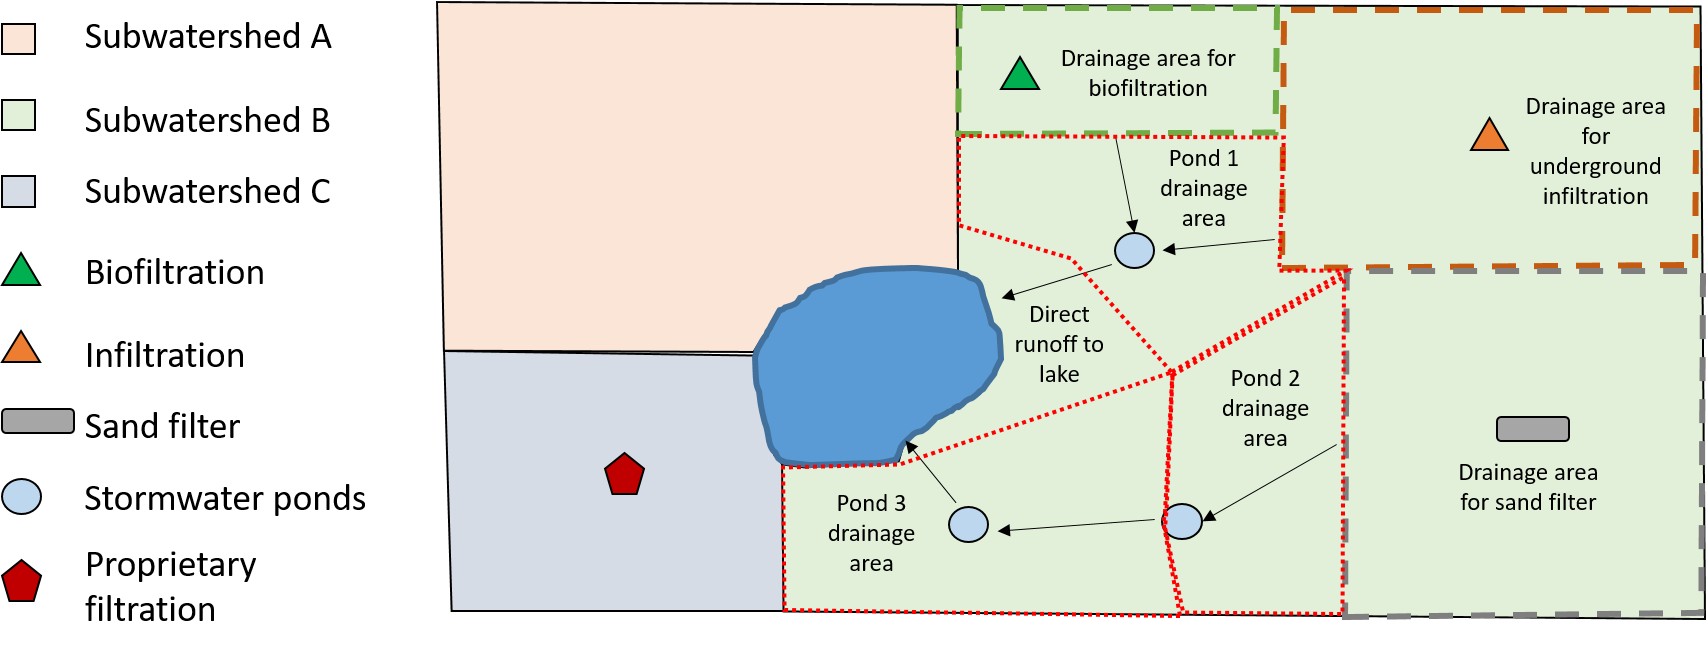
There are three subwatersheds. Subwatershed A consists of residential land use. A number of non-structural practices were implemented here, including enhanced street sweeping, neighborhood lawn leaf pick-up, an adopt-a-drain program, and impervious disconnection. Impervious surface disconnection included a rain barrel program and routing residential roof runoff to pervious areas. Subwatershed B consisted of mixed land use, including residential, commercial, industrial, and open space land uses as well as transportation and institutional areas. A stormwater treatment train approach is utilized in this subwatershed and includes an area where biofiltration practices were implemented, an area served by an underground infiltration system, and an area served by a sand filter. These areas drain to 3 regional ponds. Subwatershed C is an ultra-urban area with 80 percent impervious surface on hydrologic soil group (HSG) C soils, making infiltration infeasible. BMPs installed in this area include several proprietary underground filtration systems.
The schematic below illustrates the entire site. The goal is to reduce phosphorus loading to the lake by 40 percent.
Step 1: Entering acreages and calculating unadjusted loads
The area includes the following.
- Subwatershed A: 300 acres of residential land use
- Subwatershed B: The entire area consists of mixed (multi-use) land use, but for calculation purposes we will use a separate worksheet in the Estimator for each of the following
- 70 acres draining to biofiltration
- 175 acres draining to underground infiltration
- 275 acres draining to sand filters
- 125 acres untreated runoff draining to Pond 1 plus drainage from the biofiltration and infiltration areas
- 125 acres draining to Pond 2 plus drainage from the sand filter area
- 175 acres draining to Pond 3 plus drainage from Pond 2
- 70 acres of direct runoff (untreated)
- Subwatershed C: 200 acres of ultra-urban land use treated by proprietary underground filtration practices. We entered this land use as a user-defined land use and adjusted the runoff coefficient to 0.90 to reflect the impervious cover. The event mean concentration (emc) was assumed to be 0.24 mg/L.
There are thus 9 separate areas where calculations will be made (subwatershed A and C and seven (7) areas in subwatershed B).
Step 2: calculating adjusted loads
Adjusting loads only applies to subwatershed A, where non-structural practices are implemented. Four non-structural practices are implemented in this subwatershed.
- Enhanced street sweeping, which consisted of timing fall sweeping with leaf drop.
- A neighborhood lawn leaf pickup program was implemented. It consisted of residents raking leaves off pervious surfaces (e.g. lawns), bagging the leaves, and placing them on the curb for pickup.
- An adopt-a-drain program was implemented and 80% of the drains in the subwatershed are cleaned on a routine basis.
- An impervious surface disconnection program was implemented and consisted of residents routing roof runoff to a pervious surface or to a rain barrel that discharged to a pervious surface. Approximately 50% of the homes in subwatershed A have roof disconnection practices.
Based on monitoring data and information from the literature, we adjusted the emc down from 0.325 mg/L to 0.26 mg/L and the runoff coefficient down from 0.26 to 0.22. Note that runoff from impervious to pervious surfaces typically does not remove all the runoff generated from the impervious surface. This is particularly true for lawns that are compacted.
The resulting phosphorus reduction is 63.77 pounds or 34.81 percent of the initial load for the subwatershed.
Step 3: Accounting for load reductions by structural BMPs
Structural BMPs were implemented in subwatershed B and C. In subwatershed C, proprietary underground filtration practices were implemented and treat 150 of the 200 acres in the subwatershed. The treatment efficiency is assumed to be 0.44, which is the same as biofiltration. The resulting load reduction is 89.27 pounds or 29.7 percent of the initial load for the subwatershed.
Subwatershed B contains multiple BMPs configured as a treatment train. To account for this, we calculate loads separately for each practice (i.e. a separate worksheet is used for BMP in the Estimator).
- Direct runoff: 70 acres of the subwatershed runs off directly to the lake with no treatment
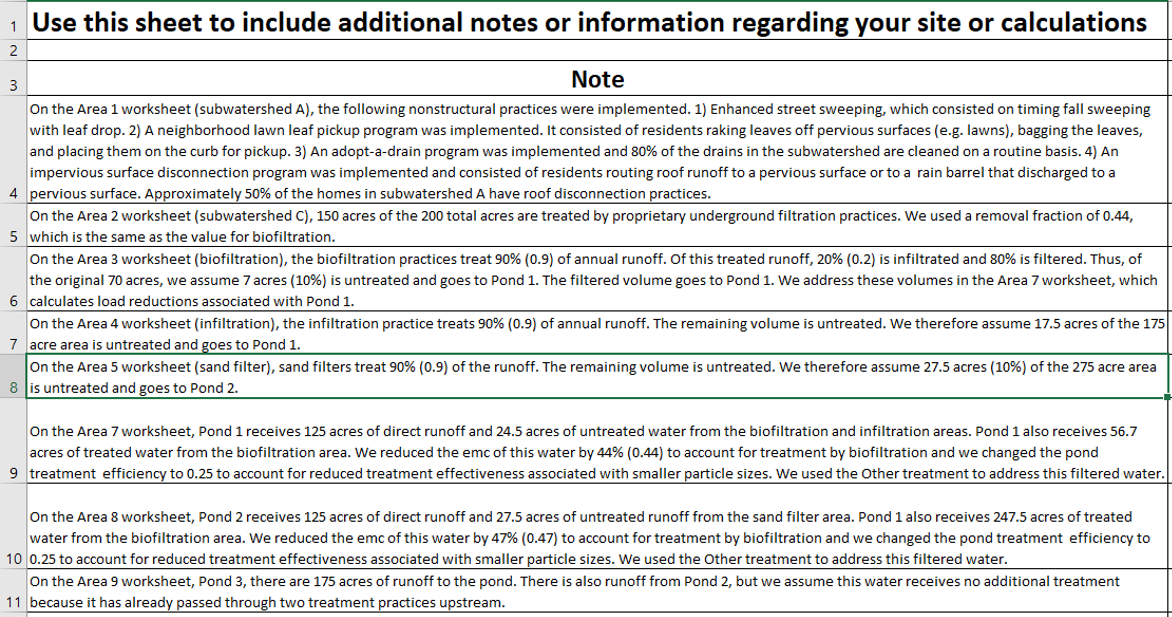
- Biofiltration: The biofiltration practices treat 90% (0.9) of annual runoff. Of this treated runoff, 20% (0.2) is infiltrated and 80% is filtered. Thus, of the original 70 acres, we assume 7 acres (10%) is untreated and goes to Pond 1. The filtered volume goes to Pond 1. We address these volumes in the calculations associated with Pond 1.
- Infiltration: The infiltration practice treats 90% (0.9) of annual runoff. The remaining volume is untreated. We therefore assume 17.5 acres of the 175 (10%) acre area is untreated and goes to Pond 1.
- Sand filters: Sand filters treat 90% (0.9) of the runoff. The remaining volume is untreated. We therefore assume 27.5 acres (10%) of the 275 acre area is untreated and goes to Pond 2.
- Pond 1: Pond 1 receives 125 acres of direct runoff and 24.5 acres of untreated water from the biofiltration and infiltration areas. Pond 1 also receives 56.7 acres of treated water from the biofiltration area. We reduced the emc of this water by 44% (0.44) to account for treatment by biofiltration and we changed the pond treatment efficiency to 0.25 to account for reduced treatment effectiveness associated with smaller particle sizes. We used the Other treatment to address this filtered water.
- Pond 2: Pond 2 receives 125 acres of direct runoff and 27.5 acres of untreated runoff from the sand filter area. Pond 1 also receives 247.5 acres of treated water from the biofiltration area. We reduced the emc of this water by 47% (0.47) to account for treatment by biofiltration and we changed the pond treatment efficiency to 0.25 to account for reduced treatment effectiveness associated with smaller particle sizes. We used the Other treatment to address this filtered water.
- Pond 3: Pond 3, there are 175 acres of runoff to the pond. There is also runoff from Pond 2, but we assume this water receives no additional treatment because it has already passed through two treatment practices upstream.
Information: Using acreages of runoff sent to downstream BMPs instead of volumes may introduce small inaccuracies in the calculations but is a simpler approach.
Reviewing results
The adjacent screen shot shows the results for each area, subwatershed, and by treatment practice. The final load of 974.93 pounds reflects a total reduction of 745.94 pounds. This is a 43.35 percent reduction in total phosphorus loading and meets the reduction goal of 40 percent. The greatest reductions, in terms of percent reduced, occurred in the area where infiltration practices were implemented, reflecting the effectiveness of these practices in reducing phosphorus loading. The reduced effectiveness of ponds 1 and 2 compared to pond 3 reflects the reduced effectiveness of BMPs located downstream of other BMPs. Treatment trains, however, have the advantage of providing redundant treatment and helping to meet challenging reduction goals. They also can reduce loading to the downstream BMPs and thus reduce the need for maintenance in the downstream BMPs.

The screen shot also shows final loading rates from each treatment area. The effectiveness of infiltration practices is again illustrated, with a final loading rate of 0.10 pounds per acre per year. Also note the relatively high loading rate from the ultra-urban area despite 75 percent of the area being treated by filtration practices. This reflects the importance of impervious surface in contributing to loading, since 90 percent of the area is impervious.
Information: In this example we were not concerned with TSS loads. This explains the results for TSS in the summary sheet
The notes page from the Estimator is also shown in an adjacent figure. This notes page is used to provide specific details or information relevant to the calculations made in the spreadsheet and worksheets.
Related pages
- MPCA Simple Estimator
- Recommendations and guidance for utilizing the MPCA Simple Estimator to meet TMDL permit requirements
- Case study for using the MPCA Simple Estimator to meet TMDL permit requirements
- Default TSS and TP loads for different land use scenarios using the MPCA Simple Estimator
- MPCA review of submittals using the MPCA Simple Estimator
- Other model pages
- Overview of models used to meet MS4 TMDL permit requirements
- Recommendations and guidance for utilizing P8 to meet TMDL permit requirements
- Case study for using P8 to meet TMDL permit requirements
- Recommendations and guidance for utilizing WINSLAMM to meet TMDL permit requirements
- Case study for using WINSLAMM to meet TMDL permit requirements
- Recommendations and guidance for utilizing the MIDS calculator to meet TMDL permit requirements
- MIDS calculator
- Case study for using the MIDS calculator to meet TMDL permit requirements