This new (October 2026) content is under construction.
This soil health guide provides a relatively quick, easy, and inexpensive means to assess soil health in soil restoration and protection work.
Contents
- Site planning
- Primary - In-Field Soil Health Assessments
- Secondary - Laboratory Soil Health Assessments
Site planning
Before going in the field, conduct a preliminary, desktop site evaluation to identify the soils, terrain, and plan for the sampling locations.
- Make a base map to print and draw on in the field. Note on the map where construction is planned, which areas will remain undisturbed, etc.
- Identify mapped soil type using the NRCS Web Soil Survey. Note that some soils are too disturbed for Web Soil Survey to give you a preview of the soils at your site, or that actual soils can vary from mapped soils; this is a preview and must be ground-truthed. Review the soil texture, slope, hydrologic soil group and more. After making your soil map, click “add to cart” for a free downloadable document with your map and soil series descriptions.
- Review the terrain and topography using Google maps terrain layer, construction specification map, GIS data, or USGS The National Map. Observe the topography of your site (note slope convexities, planar areas, etc.) to guide your sampling, including the topslope, side slope, and downslope landscape positions.
- Topslope (convex): This zone of the landscape includes the summit and shoulder hillslope positions and is a zone that is dominated by soil erosion. Even where stable vegetation exists, gravity and rain still manage to erode soil from this landscape position. This landscape position usually has the shallowest topsoil.
- Side slope (planar backslope): This zone in the landscape is a flow-through zone. Usually, the amount of material eroding in matches the amount eroding out. The topsoil depth in this zone is sometimes hard to identify because the soil mixes as it moves, but this landscape position may have slightly more topsoil than the topslope positions.
-
Downslope (concave): This zone in the landscape includes the footslope and toeslope hillslope positions and is collecting eroded material from the topslope (by way of the side slope). The topsoil depth in concave parts of the landscape usually has the deepest topsoil.
[IMAGE COMING - Illustrating above landscape positions]
- Plan for soil measurements and soil samples in each of the three landscape positions. For each set of three landscape positions, try to align sample locations with the slope as water might flow (a transect or catina) from the topslope, though the side slope, and into the downslope location. In a 5-acre site, identify a minimum of two transects with three hillslope positions on each transect, for a minimum of 6 sample locations. Larger sites would scale up from this baseline. Method source: Schaetzl, R.J. and Thompson, M.L., 2024. Soils: Genesis and Geomorphology. 2nd Edition. Cambridge University Press.
- Review the site history and previous uses to determine if you need to screen for contaminants.
Primary - field assessments for soil health
The eight primary soil health assessments are summarized in the table and discussed in detail below. The Example Soil Sample Field Sheet is available to record samples. The sample locations, vegetation notes, and other site information should also be recorded on the map.
| Measurement | Purpose | Materials | Target Values | Action Threshold |
|---|---|---|---|---|
| Compaction | Determine extent and depth of compaction | Cone penetrometer or fiberglass rod | Below 150 psi penetration resistance |
>200 psi penetration resistance |
| Infiltration | Runoff resistance, capacity to take in precipitation | Double ring infiltrometer, or coffee can/paint can with top and bottom removed, water bottle, plastic wrap, 5-gallon water jug, stopwatch. | 2 inches of water takes less than 15 minutes to infiltrate | Less than 1 inch in 30 minutes (terminating measurement) |
| Topsoil depth | Erosion history and planning for depth required to strip topsoil for construction | Tape measure, shovel (preferably sharp shooter) | Minimum of 8” | Less than 6” |
| Soil Texture | Determine baseline water holding capacity | Shovel, bare hands, water spray bottle, and flowchart | N/A | N/A |
| Soil Structure | Runoff resistance, indications of soil history | Shovel, Visual Evaluation of Soil Structure (VESS) chart, tray or plastic sheet | Granular (1-3 on VESS test) | Other soil structures as described |
| Soil Color | Presence of absence of organic matter and hydraulic disfunction | Shovel, consistent lighting | Black or dark brown | Tan and other colors as described |
| Aggregate Stability | AWC, runoff resistance, plant sustenance | Shovel, sample bag (paper bag or box to prevent crushing), bottle cap/cup (or mobile phone if using Slakes app) |
S = Stable
|
M = Melts or D=Disintegrates
|
| Vegetation survey | Diverse, dense, and deep vegetation keep and build soil; check for invasives | Work with a vegetation specialist | Work with a vegetation specialist | Work with a vegetation specialist |
Compaction by penetrometer
The pressure required to push a penetrometer into the soil helps determine if there are subsoil layers that are too compacted for roots and water to penetrate. Penetration resistance values as low as 150 psi can affect root growth (1 MPa) and values of 300 psi (2 MPa) restrict root growth. Soil compacted by machinery can have penetration resistance as high as 1,500 psi (10 MPa). MnDOT has been using 200 psi as an action threshold for decompaction, and some cities and watershed districts are specifying <200 psi in ordinances. The following Penetrometer methodology is adapted from Penn State Extension.
Materials:
- Cone penetrometer (dynamic or static) with a pressure dial.
- Alternate, simple probe method: a fiberglass probe or fiberglass driveway marker rod with a pointed tip.
- Tape measure
Method:
-
Ensure the soil is at the appropriate moisture before conducting the test. Penetrometry results can vary substantially with differences in soil texture and moisture (drier soils have higher resistance). The ideal time for penetrometry is when the soil is near field capacity, or approximately 1-3 days after a rainfall event. A very dry soil will result in penetrometer readings that are too high and should not be used for decision-making. Additional soil moisture will result in easy penetration.
To test soil moisture, take a small amount of topsoil and squeeze it into a ball in one hand. If the soil is able to hold together and water appears briefly on the soil surface after squeezing or shaking, then the soil is at field capacity and appropriate for penetrometry measurements. Estimating Soil Moisture by Feel and Appearance provides full instructions. Soil that assesses at 75-100% available water capacity using this test should be sufficient for penetrometry.
- Push the penetrometer into the ground at a rate of 1 inch per second.
- Record the PSI at 4, 8, 12, 16, 20, and 24 inches.
- If the penetrometer reaches 300 psi, record the depth, even if it is not at one of the 4-inch intervals.
- Continue pressing into the ground to see if the penetration resistance falls below 300 psi and record the depth when the resistance drops. The beginning and end of >300 psi is the top and bottom of the root-limiting compacted zone.
- Repeat this measurement at each sample site 10 times (expect this to take less than 15 minutes per site).
- If you hit “refusal” and are unable to push the probe into the ground (or the probe is too difficult to reasonably pull out after a certain depth), record this depth and note the penetrometer pressure and that you experienced refusal.
Alternate method (simple probe):
- Push the simple probe into the ground
- Record the depth when resistance to insertion is high.
- If you are able to continue through the resistant layer, record the depth when resistance decreases. This will approximate the top and bottom of the root-limiting zone.
Restoration actions:
- Use your determination of compaction zone depth at each hillslope position to determine the depth of decompaction required at the site. See Restoring Soil Health in Established Landscapes and Preserving and Restoring Soil Health in Construction for guidance on alleviating compaction.
Infiltration by ring infiltrometer (falling head)
Measuring the time to infiltrate 2 inches of water in a single or double ring is an inexpensive and efficient method for soil health assessment. Infiltration methods and instrumentation used for estimating saturated hydraulic conductivity may be used but are more costly and not necessary for the purposes of soil health tracking. For more information on those methods, and when they might be warranted, see Determining soil infiltration rates | Minnesota Stormwater Manual.
Materials:
- Infiltration ring with a diameter of 4-6 inches. If you do not have a manufactured infiltrometer, a sturdy ring that is at least 6 inches tall and a diameter of 4-6 inches will work. Suggestions include a metal coffee can with bottom and top removed, an unused metal paint can with the bottom removed, or a segment of PVC pipe (minimum diameter of 4-inches).
- Bottle of water or plastic cylinder marked with the volume of water required to make one inch of water
- Plastic wrap
- Water (clean, potable water is sufficient, though some protocols ask for distilled)
- Stopwatch or timer
- Garden scissors
- Soil knife (hori-hori) or small trowel
- Rubber hammer
- 2x4 or similar sturdy block of wood, twice as long as your ring diameter
- Ruler or tape measure
Method (adapted from NRCS Measuring Soil Health: Infiltration)
- Make each set of infiltration measurements at the topslope and bottom slope. No need to measure on the side slope.
- Using garden scissors, trim vegetation close to the soil surface where your ring will insert.
- Select an area that has not had soil penetrometer measurements because these new macropores will give you an inaccurate test.
- Drive the ring into the ground with a rubber hammer by setting the block of wood over the ring and hammering the block of wood. You may trace the outside of the ring with a soil knife or trowel to ease the ring into the ground. Drive the ring into the ground 2-3 inches deep.
- Place a piece of plastic wrap over the ring and gently press down to the soil surface while still lining the inside of the infiltration ring. This will allow all of the water to hit the ground at once and limit disturbance of the soil surface from pouring the water directly from the bottle.
- If you have access to a double-ring infiltrometer, keep the external ring filled with water during your infiltration testing. This ensures that your measurement is vertical infiltration and will be more effective than a single ring measurement at diagnosing a hydraulically restrictive layer near the soil surface.
- Fill a plastic bottle with the correct volume of water for the diameter (calculation available on Example Soil Health Field Sheet, for a 6-inch diameter ring, you will need 15.7 oz or 463 mL of water).
- Gently pour the water into the ring lined with plastic wrap.
- Gently remove the plastic wrap and begin your timer. Watch as the water infiltrates into the soil. Be sure that no water is leaking outside the ring on the soil surface (if it does, restart by inserting the ring in a new spot). Record the amount of time in minutes it takes to infiltrate the full inch of soil. The soil surface will look wet but have no standing water when the inch has completely infiltrated.
- If the first inch requires more than 30 minutes to infiltrate, you do not need to do a second inch. At 30 minutes, measure and record the depth of water remaining in the ring. You can use this fraction to estimate your inch per hour calculation.
- Do not remove the ring for the second inch of water. Replace the plastic wrap over the ring, refill with an inch of water, and begin timing the second inch.
Topsoil depth and sample collection
Materials:
- Tape measure
- Shovel (preferably sharp shooter)
Method:
- Insert a shovel with the blade vertical into the soil until the blade is fully inserted or you reach refusal. Repeat three times to make a square. Use the shovel blade to remove each block of soil, keeping the soil as intact as it allows. You will use this soil for texture, structure, and color analysis in the field. You will take samples to the office for aggregate stability, and secondary (lab) analyses.
- Plan to refill the hole you make with any soil that you do not take for sampling, keeping any vegetation intact on top of the soil. If you need to remove subsoil, return it in appropriate layers.
- As you exhume the soil, note the depth where color changes. Topsoil is usually a darker color than subsoil due to higher organic matter content. It is generally more fluffy and has a different structure than the subsoil. At each sample location, note the depth extent of the topsoil.
- This depth is the guide for stripping and stockpiling the topsoil.
- The topsoil might be within or close to your single shovel blade depth at the topslope and side slope. You will most likely have to dig or auger deeper at the downslope sites to find the subsoil.
- Collect one set of samples at each sample location (see section 2: Site Planning). For each of these samples you will collect a quart-sized zipper bag for optional secondary analyses (at an external lab, see below) and a paper lunch bag or other small container that remains uncompacted to air dry for assessing water stable aggregates (below).
Soil texture by ribbon
Materials:
Method (refer to detailed flow chart at NRCS Soil Health – Soil Texture and Structure)
- Moisten a small handful of soil and knead it until it is like putty or Play-Doh. Roll it into a ball.
- Squish the ball between your thumb and forefinger to make a ribbon that is pretty thin (less than ⅛ inch thick) and see how long you can make the ribbon; more clay will produce longer ribbons.
- Rub the soil in the palm of your hand and feel for grit (sand), smoothness (silt), and stickiness (clay).
Soil structure
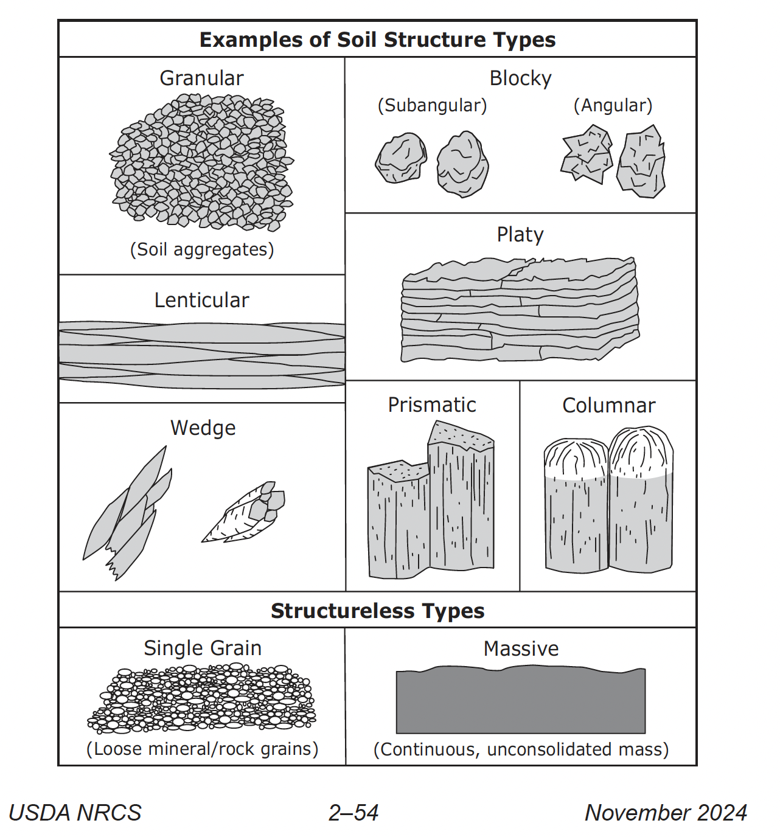
The shape of soil peds, or the way a soil holds together on its own when we collect a shovel full of soil, can be an indicator of soil health. Note that the structure will probably change with depth; if it does, note the different soil structures and the depth where they change.
Method 1: Visual Assessment of Soil Structure test (Aarus University, UEM, and SRUC). Soils that score between 1-3 on the Visual Assessment of Soil Structure are considered acceptable.
Method 2: Manually assess using NRCS Soil Health – Soil Texture and Structure. Identifying which structures are healthy is somewhat dependent on the soil series. However, we can generalize the following:
-
Granular: Associated with high organic matter with microbial processes and root exudates to bind together the structures. Granular is the target value for healthy soil structure.
Action: Healthy topsoil. Preserve with continued perennial vegetation.
-
Subangular blocky: Often associated with clay increasing with depth. Common in subsoil (B-horizon). In topsoil this represents heavy management and topsoil disruption such as tillage.
Action: Use soil test for nutrient recommendations and establish perennial vegetation.
-
Angular blocky and prismatic: Sometimes occurs in subsoil B-horizons where there is significant clay. The dominant hydrology of soils with these structures will occur between the peds, or in the macropores. This means that water will generally flow through quickly and the peds usually do not have significant capacity to store water.
Action: Use penetrometer testing to determine decompaction needs. Use soil tests for nutrient recommendations and establish perennial vegetation. Compost incorporation and living roots are more likely to benefit infiltration than sand amendment because they alter soil structure and not just soil texture.
-
Columnar: Distinct from prismatic by exhibiting rounded tops. Occurs where there is significant clay and salts in arid regions. This structure can occur in southwestern Minnesota. The soil within the columns is generally low permeability, so this type of soil depends on the macropore breaks between the columns for water flow. However, where the clays are shrink-swell, these soils will restrict permeability.
Action: Use penetrometer testing to determine decompaction needs. Use soil tests for nutrient recommendations and establish perennial vegetation. Compost incorporation and living roots are likely to benefit infiltration but may require irrigation for establishment.
-
Platy: Horizontal plates can form in E-horizons (forested soils) and can also occur due to compaction from machinery. Also occurs from deposition of eroded soil and from ice lens growth in arctic soils. This structure is limiting for water movement and root growth.
Action: If platy structure is from deposition of eroded materials, use penetrometer testing to determine decompaction needs. Use soil tests for nutrient recommendations and establish perennial vegetation.
-
Wedge: Forms in clay rich soil in which the clay minerals shrink and swell with wetting and drying cycles (not all clays do this). This structure limits water and gas movement. In Minnesota these are most likely to occur in the northwest.
Action: Use penetrometer testing to determine decompaction needs. Use soil tests for nutrient recommendations and establish perennial vegetation. Compost incorporation and living roots are more likely to benefit infiltration than sand amendment because an abundant amount of sand is necessary to alter this soil texture, and compost/roots increase structural porosity.
-
Massive: the soil is a coherent mass without aggregates. This generally restricts water flow unless the soil is forming on a parent material that has a high hydraulic conductivity, such as sandstone, glacial outwash, or other sandy parent material that hasn’t been pedogenically altered and has not developed soil structure.
Action: If you find massive structure in the topslope, the soil may be deeply eroded to subsoil. Topsoil addition in combination with decompaction, compost, fertilizers, and vegetation establishment may be warranted to establish topsoil.
Soil color by visual assessment
Method 1: Use the Munsell color system. This method is the standard for assessing soil color, but swatch books are expensive.
Method 2: Observe the color without quantitative soil color analysis.
Soil colors and relevance are discussed below.
- Brown and black soil colors are from organic matter. The darker the brown/black, the higher the organic matter in the soil. Organic matter is important for storing water, air, microorganisms, and nutrients in the soil, which are critical for plant growth and infiltration. At a minimum, a soil needs 3% organic matter to support plant growth. Any topsoil with <5% organic matter would benefit from compost addition to support plant growth and infiltration. On any Munsell soil color page, a Value and Chroma below 3 indicates high organic content and would not warrant compost amendment.
- Gray soil color can mean that soil is devoid of organic matter and oxide minerals, and the gray color comes from bare minerals. In most cases this means that soil experiences extended periods of anoxic conditions due to saturation of stagnant water. Sometimes a soil that is consistently waterlogged will also develop regions or “mottles” of blue and green. The saturated conditions that produce these colors are called gleyed soils. Unless they occur as a lens surrounded by other soil colors, gray soils will require extreme drainage to support infiltration and soil health and should not be considered for stormwater applications.
- Orange, red, and yellow tints or colors are from oxide minerals.
- When orange-red-yellow colors are distributed throughout the subsoil and do not occur in spots (Munsell Y, R, and YR cards), this means that the soil contains iron oxide minerals and is persistently oxygenated. This soil can support infiltration and stormwater applications.
- When orangey spots occur in a soil, this means the soil has gone anoxic for a portion of the year. These oxide minerals have undergone reduction reactions (microbially mediated chemical changes). When oxygen returns to the soil, the minerals will again oxidize (like rust) in concentrated in spots or mottles or nodules. These spots are called “redoximorphic” features, and they are persistent in soil and are important hydrologic indicators of a high water table or low permeability.
- If orange spots are surrounded by gray soil, as above, these soils will require extreme drainage to support infiltration and soil health and, unless they occur as a lens surrounded by other soil colors, these should not be considered for stormwater applications.
- Purple-black nodules, often accompanying orange redox concentrations, are from manganese oxides. They also represent conditions that wet the soil for a long enough duration for the soil to become anoxic for part of the year (approximately weeks to months). Because manganese is less abundant in soils, these features are less common than iron-containing concentrations. Follow guidance for orange redoximorphic features regarding stormwater applications for this soil.
- White spots may occur in soil as mineral deposits from carbonate minerals or salts. These tend to occur where rainfall is not abundant. Carbonate concentrations are usually an indicator that the parent material is either calcareous glacial deposits or limestone bedrock. Depending on balance of rainfall vs evapotranspiration, the carbonate minerals will dissolve and mobilize to deeper parts of the soil, and where the carbonates accumulate, the soil will develop white/light nodules or an overall appearance that is light or white. Horizons with concentrated white mineral deposits (salts or carbonates) are likely to restrict water movement at the depth of the white mineral concentrations.
Aggregate stability
The ability of a soil clod or ped to hold together when wet is a key indicator of soil health. When roots and microbes are active and diverse in the root zone of a soil, the structure that develops will not break when rain or flood water encounters the soil. Stable soil aggregates act like sponges in the soil and have the capacity to store and transmit water. To test soil aggregates, there are time-consuming and costly lab methods, but the Soil Stability Bottle Cap test is an appropriate, inexpensive, and accessible indicator to estimate the erosion resistance of a soil.
Method 1: Bureau of Land Management Soil Stability Bottle Cap Test (modified):
- Air dry the soil you collected in the paper bag and select at least three small soil clods (about 6-8 mm in diameter) and put it in a bottle cap that is filled with water.
- Watch the soil fragment for 30 seconds.
- Gently swirl the water for 5 seconds.
- Assign one of the following stability ratings
M = Melts in the first 30 seconds (without swirling). This soil is hydrologically unstable and requires restoration to accommodate infiltration.
D = Disintegrates when swirled (but does not melt). This soil is hydrologically moderately stable and would benefit from restoration to accommodate infiltration.
S = Stable (even after swirling). This soil is hydrologically stable and can accommodate infiltration. - Repeat the bottle cap test for each sample location within each monitoring site. An increase in soil stability over time means that the risk of erosion has decreased at that site.
Method 2: Soil Health Institute Slakes App
Vegetation biodiversity and density by visual assessment
Specific guidance related to vegetation biodiversity and density has not been developed as part of this guidance. Please work with your vegetation specialist. Some factors that may be considered include:
- Sunlight: Full sun, partial sun, or shade
- Bare soil percentage
- Plant functional groups: grasses, sedge, legumes (nitrogen-fixing), other forbes (broadleaf, herbaceous, non-woody, non-N-fixing)
- Woody and deep-rooted species
- Invasive species presence, types, and dominance
Secondary - Laboratory assessments for soil health
The secondary set of soil health assessments is designed to provide inexpensive yet informative laboratory measures. These tests are not needed in all cases and should be considered if they afford cost savings during project implementation, to meet a specific requirement, or for challenging or important projects.
| Measurement | Purpose | Methods/Tools | Target Values | Action Threshold |
|---|---|---|---|---|
| Soil Organic Matter | Nutrient and water holding capacity | Shovel, sample bag. | 5-15% SOM (3-9% SOC) |
<5% SOM |
| Bulk Density | Determine extent and depth of compaction | Coring device with liner, slide hammer. | <1.1 g/cc | >1.3 g/cc |
| Basic Soil Chemistry (Nutrients and pH) | Assess need to amend | Shovel, sample bag. |
Follow soil testing guidelines for desired vegetation pH between 6-8 |
Follow test results for desired vegetation. pH < 6 or >8 follow guidelines by soil testing agency. |
Use a set of soil tests that will measure at a minimum the following soil properties: soil organic matter, phosphorus, potassium, pH, and soil texture. The “Regular Test” from the “Lawn, Garden, and Landscape” form from the University of Minnesota Research Analytical Lab is an example. Unless your project has a specific garden plan, select fertilizer recommendations for Lawn (before seeding or existing, as appropriate for your site).
Samples should be composites (mixed together) from each landscape position. In other words, there will be three topsoil samples to send to the analytical lab: topslope composite, side slope composite, and bottom slope composite.
Soil organic matter (SOM)
Organic matter in soil reduces bulk density, stores and transmits water, aids infiltration, and supplies nutrients for plant growth.
Note that soil organic matter is often measured by loss on ignition. The total SOM is composed of the following elements, approximated depending on the type of organic matter: 40-60% carbon, ~40% oxygen, ~5% hydrogen, ~4% nitrogen, and ~1% sulfur.
Action: if SOM is lower than 5% (~3% organic carbon), your site warrants compost amendment. Compost amendment is warranted for SOM values up to 15% (Swetha et al, 2022).
Bulk density
Bulk density provides a more precise measurement of soil compaction, root penetration, and porosity (i.e. saturated water holding) than penetrometry. Bulk density measurements can be valuable for the purpose of documenting improvements to soil health. Values as low as 1.1 to 1.4 g/cm3 can impact plant growth depending on soil texture, and values >1.6 g/cm3 restrict root growth. Refer to the bulk density table on Soil Health Indicator Sheet for more details.
Bulk density can be rapidly and accurately collected over depth profiles when using a soil recovery probe with liner. An effective soil recovery probe has sharp cutting head orifice with a slightly smaller inner diameter than the plastic sleeve, eliminating compaction of the soil in the sleeve. Plugging therefore only happens in the bottom half-inch of the steel tip, preserving the soil already in the plastic sleeve from any compaction and making it easy to remove the sleeve from the coring device for subsampling and analysis in the office or lab.
Basic soil chemistry (nutrients and pH)
Nutrients and pH measurement can determine if lime/gypsum or other amendments are needed for plant fertility or microbial activity. Note that compost will provide many nutrients and organic matter.
Use the recommendation from your soil testing lab for fertilizer requirements of your soil and cross-check those requirements with the manufacturer's chemical analysis of your compost to ensure that you do not add excess nitrogen or phosphorus. In most cases, phosphorus is not necessary or recommended in urban soils.
If pH is below 6.3, the soil would benefit from lime application. This will allow the soil microorganisms to thrive and for the soil to release more nutrients to plants.