This page provides a discussion of how bioretention practices can achieve stormwater credits. Bioretention systems with and without underdrains are both discussed, with separate sections for each type of system as appropriate. In this discussion, bioretention systems with an underdrain are called biofiltration systems, while bioretention systems with no underdrain are called bioinfiltration systems.
| TSS | TP | PP | DP | TN | Metals | Bacteria | Hydrocarbons |
|---|---|---|---|---|---|---|---|
| 80 | link to table | link to table | link to table | 50 | 35 | 95 | 80 |
| TSS=total suspended solids; TP=total phosphorus; PP=particulate phosphorus; DP=dissolved phosphorus; TN=total nitrogen | |||||||
Warning: Models are often selected to calculate credits. The model selected depends on your objectives. For compliance with the Construction Stormwater permit, the model must be based on the assumption that an instantaneous volume is captured by the BMP. For more information on using models to calculate credits see Methods and resources for calculating credits.
Green Infrastructure: Bioretention practices can be an important tool for retention and detention of stormwater runoff. Because they utilize vegetation, bioretention practices provide additional benefits, including cleaner air, carbon sequestration, improved biological habitat, and aesthetic value.
Credit refers to the quantity of stormwater or pollutant reduction achieved either by an individual best management practice (BMP) or cumulatively with multiple BMPs. Stormwater credits are a tool for local stormwater authorities who are interested in
- providing incentives to site developers to encourage the preservation of natural areas and the reduction of the volume of stormwater runoff being conveyed to a best management practice (BMP);
- complying with permit requirements, including antidegradation (see Construction permit; Municipal (MS4) permit);
- meeting the MIDS performance goal; or
- meeting or complying with water quality objectives, including total maximum daily load (TMDL) wasteload allocations (WLAs).
Contents
Overview
Bioretention is a terrestrial-based (up-land as opposed to wetland) water quality and water quantity control process. Bioretention consists of an engineered soil media layer designed to treat stormwater runoff via filtration through plant and soil media, evapotranspiration from plants, or through infiltration into underlying soil. Pretreatment is REQUIRED for all bioretention facilities to settle particulates before entering the BMP. Bioretention practices may be built with or without an underdrain. Other common components of bioretention systems may include a stone aggregate layer to allow for increased retention storage and an impermeable liner on the bottom or sides of the facility if located near buildings, subgrade utilities, or in Karst formations. Bioretention is a versatile stormwater treatment method applicable to all types of settings such as landscaping islands, cul-de-sacs, parking lot margins, commercial setbacks, open space, rooftop drainage, and streetscapes.
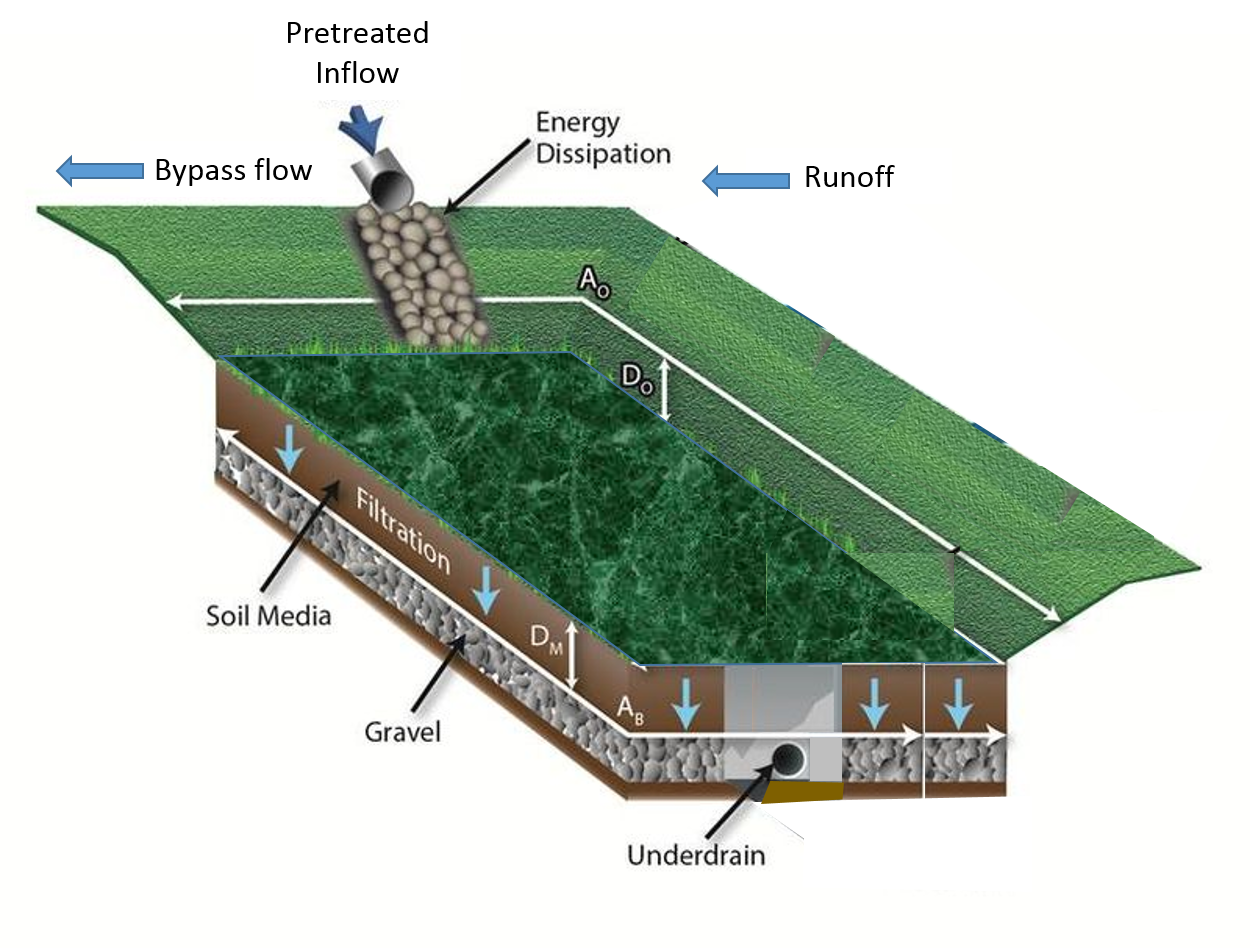
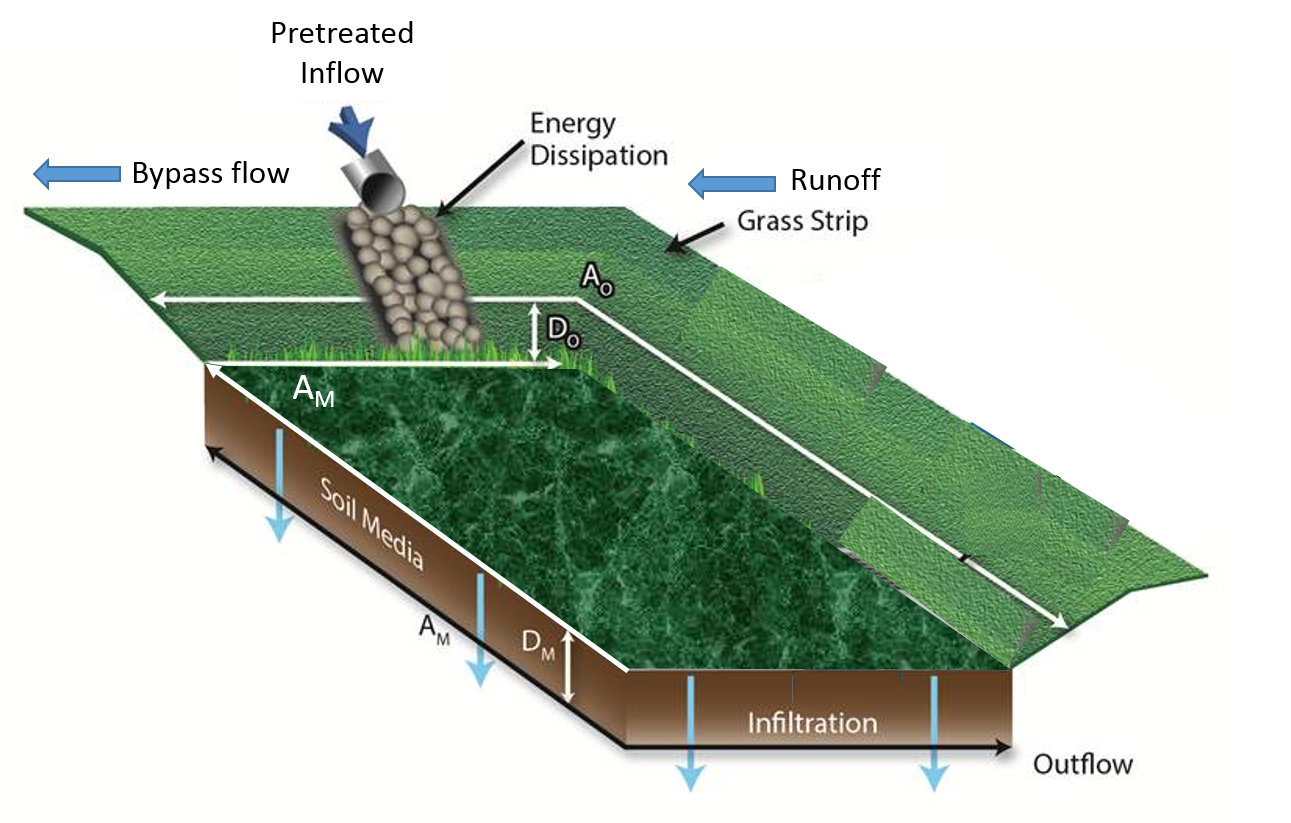
Systems with no underdrain are called bioinfiltration, while those with an underdrain are called biofiltration. Biofiltration, commonly termed bioretention with underdrains, is primarily a stormwater quality control practice. Some water quantity reduction can be achieved through infiltration below the underdrain, particularly if the underdrain is raised above the bottom of the BMP, and through evapotranspiration. Biofiltration includes an underdrain layer to collect the filtered runoff for downstream discharge.
See Bioretention terminology for a discussion of different types of bioretention systems. Although tree trenches and tree boxes are a form of bioretention, they are discussed separately in this manual.
Warning: The Construction Stormwater permit REQUIRES pretreatment for bioretention practices
Pollutant removal mechanisms
Bioretention practices have one of the highest nutrient and pollutant removal efficiencies of any BMP. Bioretention provides pollutant removal and volume reduction through filtration, evaporation, infiltration, transpiration, biological and microbiological uptake, and soil adsorption; the extent of these benefits is highly dependent on site specific conditions and design. In addition to phosphorus and total suspended solids (TSS), which are discussed in greater detail below, bioretention treats a wide variety of other pollutants.
Removal of phosphorus is dependent on the engineered media. Media mixes with high organic matter content typically leach phosphorus and can therefore contribute to water quality degradation. The Manual provides a detailed discussion of media mixes, including information on phosphorus retention.
Location in the treatment train
Stormwater treatment trains are multiple BMPs that work together to minimize the volume of stormwater runoff, remove pollutants, and reduce the rate of stormwater runoff being discharged to Minnesota wetlands, lakes and streams. Bioretention facilities are typically located in upland areas of the stormwater treatment train, controlling stormwater runoff close to the source.
Methodology for calculating credits
This section describes the basic concepts and equations used to calculate credits for volume, Total Suspended Solids (TSS) and Total Phosphorus (TP). For specific tools and methods that can be used to calculate credits see Methods and resources for calculating credits.
Bioinfiltration practices generate credits for volume, TSS, and TP. Biofiltration practices do not substantially reduce the volume of runoff but may qualify for a partial volume credit as a result of evapotranspiration, infiltration occurring through the sidewalls above the underdrain, and infiltration below the underdrain piping. Bioretention practices are effective at reducing concentrations of other pollutants including nitrogen, metals, bacteria, and hydrocarbons. This article does not provide information on calculating credits for pollutants other than TSS and TP, but references are provided that may be useful for calculating credits for other pollutants.
Assumptions and approach
In developing the credit calculations, it is assumed the bioretention practice is properly designed, constructed, and maintained in accordance with the Minnesota Stormwater Manual. If any of these assumptions is not valid, the BMP may not qualify for credits or credits should be reduced based on reduced ability of the BMP to achieve volume or pollutant reductions. For guidance on design, construction, and maintenance, see the appropriate article within the bioretention section of the Manual.
Warning: Pre-treatment is required for all bioretention practices
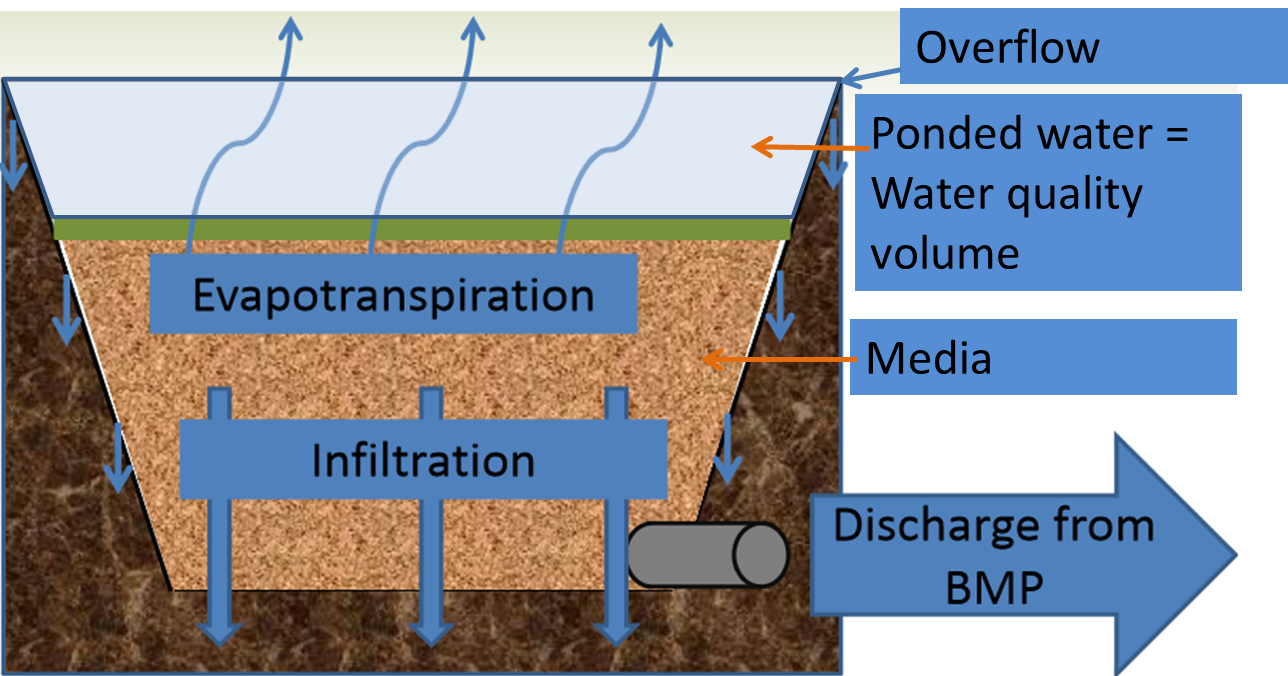
In the following discussion, the Water Quality Volume (VWQ) is delivered instantaneously to the BMP. The VWQ is stored as water ponded above the filter media and below the overflow point in the BMP. The VWQ can vary depending on the stormwater management objective(s). For construction stormwater, VWQ is 1 inch off new impervious surface. For MIDS, VWQ is 1.1 inches.
In reality, some water will infiltrate through the bottom and sidewalls of the BMP as a rain event proceeds. The instantaneous volume method therefore may underestimate actual volume and pollutant losses.
Volume credit calculations - no underdrain
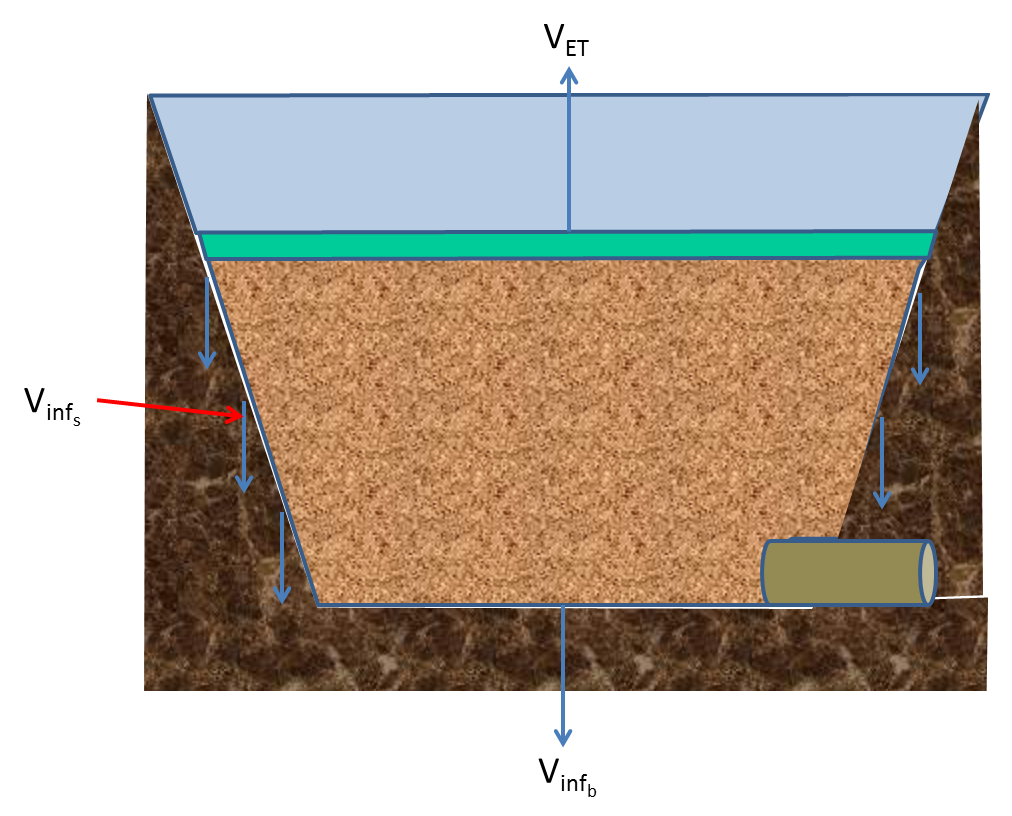
Volume credits are calculated based on the capacity of the BMP and its ability to permanently remove stormwater runoff via infiltration into the underlying soil from the existing stormwater collection system. These credits are assumed to be instantaneous values entirely based on the capacity of the BMP to capture, store, and transmit water in any storm event. Because the volume is calculated as an instantaneous volume, the water quality volume (VWQ) is assumed to pond below the overflow elevation and above the bioretention media. This entire volume is assumed to infiltrate through the bottom of the BMP. The volume credit (Vinfb) for infiltration through the bottom of the BMP into the underlying soil, in cubic feet, is given by
$^V_{inf_b} = D_o\ (A_O + A_M)\ / 2^$
Where:
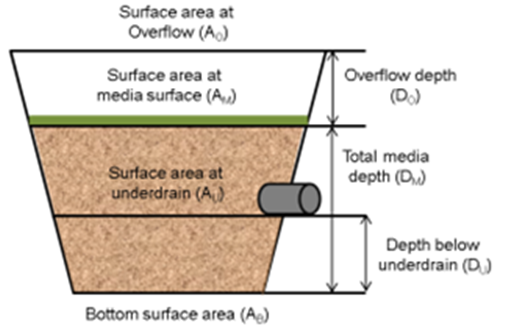
AO is the overflow surface area of the bioretention system, in square feet;
AM is the area at the surface of the media, in square feet; and
DO is the ponded depth with the BMP, in feet.
Some of the VWQ will be lost to evapotranspiration rather than all being lost to infiltration. In terms of a water quantity credit, this differentiation is unimportant, but it may be important if attempting to calculate actual infiltration into the underlying soil.
The annual volume captured and infiltrated by the BMP can be determined with appropriate modeling tools, including the MIDS calculator. Example values are shown below for a scenario using the MIDS calculator. For example, a permeable pavement system designed to capture 1 inch of runoff from impervious surfaces will capture 89 percent of annual runoff from a site with B (SM) soils.
Volume credit calculations - underdrain
Volume credits for biofiltration are available only if the BMP permanently removes a portion of the stormwater runoff via infiltration through sidewalls or beneath the underdrain piping, or through evapotranspiration. These credits are assumed to be instantaneous values based on the design capacity of the BMP for a specific storm event. Instantaneous volume reduction, also termed event based volume reduction, can be converted to annual volume reduction percentages using the MIDS calculator or other appropriate modeling tools.
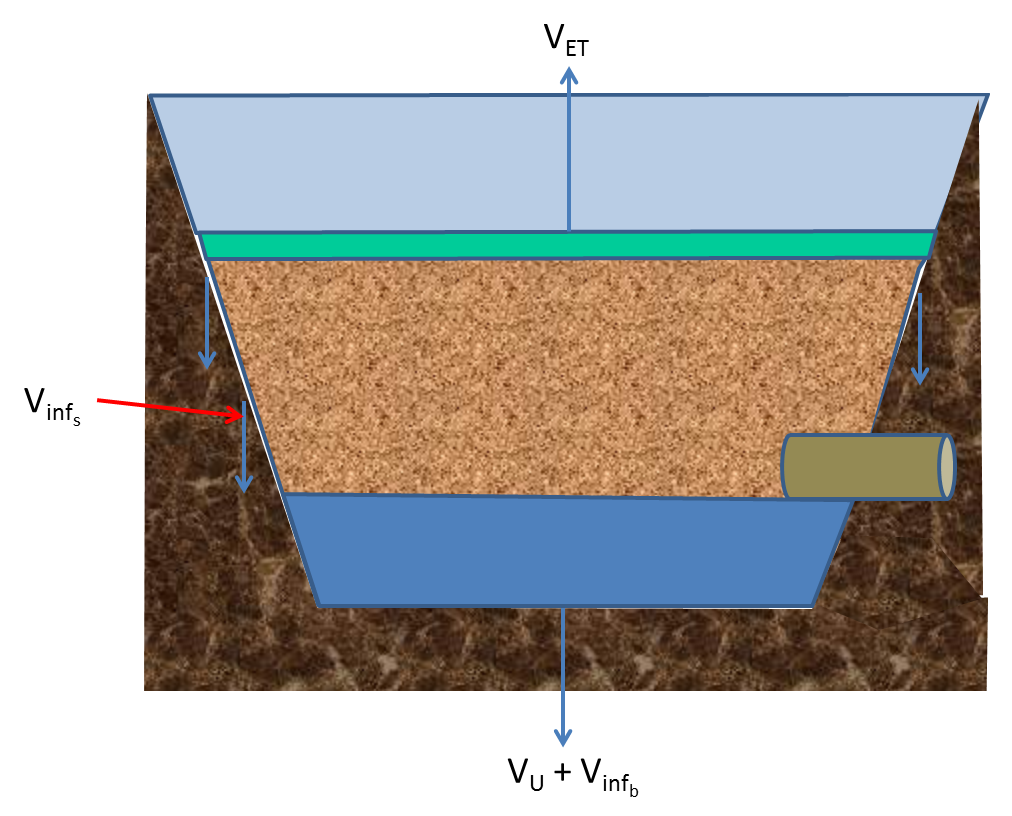
Volume credits for biofiltration basins with underdrains are calculated by a combination of infiltration through the unlined sides and bottom of the basin, the volume loss through evapotranspiration (ET), and the retention volume below the underdrain, if applicable (this is based on the assumption that this stored water will infiltrate into the underlying soil). The main design variables impacting the volume credits include whether the underdrain is elevated above the native soils and if an impermeable liner on the sides or bottom of the basin is used. Other design variables include surface area at overflow, media top surface area, underdrain location, and basin bottom locations, total depth of media, soil water holding capacity and media porosity, and infiltration rate of underlying soils.
Information: For the following equations, units most commonly used in practice are given and unit correction factors are based on those units
The volume credit (V) for biofiltration basins with underdrains, in cubic feet, is given by
$^ V = V_{inf_B} + V_{inf_s} + V_{ET} + V_U ^$
Where:
Vinfb = volume of infiltration through the bottom of the basin (cubic feet);
Vinfs = volume of infiltration through the sides of the basin (cubic feet);
VET = volume reduction due to evapotranspiration (cubic feet); and
VU = volume of water stored beneath the underdrain that will infiltrate into the underlying soil (cubic feet).
Volume credits for infiltration through the bottom of the basin (Vinfb) are accounted for only if the bottom of the basin is not lined. As long as water continues to draw down, some infiltration will occur through the bottom of the BMP. However, it is assumed that when an underdrain is included in the installation, the majority of water will be filtered through the media and exit through the underdrain. Because of this, the drawdown time is likely to be short. Volume credit for infiltration through the bottom of the basin is given by
$^ V_{inf_B} = A_B\ DDT\ I_R/12 ^$
Where:
IR = design infiltration rate of underlying soil (inches per hour);
AB = surface area at the bottom of the basin (square feet); and
DDT = drawdown time for ponded water (hours).
Information: The MIDS calculator assigns a default value of 0.06 inches per hour, equivalent to a D soil, to IR. This is based on the assumption that most water will drain to the underdrain, but that some loss to underlying soil will occur. A conservative approach assuming a D soil was thus chosen.
The drawdown time is typically a maximum of 48 hours, which is designed to be protective of plants grown in the media. The Construction Stormwater permit requires drawdown within 48 hours and recommends 24 hours when discharges are to a trout stream. With a properly functioning underdrain, the drawdown time is likely to be considerably less than 48 hours.
Volume credit for infiltration through the sides of the basin is accounted for only if the sides of the basin are not lined with an impermeable liner. Volume credit for infiltration through the sides of the basin is given by
$^V_{inf_s} = (A_O - A_U)\ DDT\ I_R/12^$
Where:
AO = the surface area at the overflow (square feet); and
AU = the surface area at the underdrain (square feet).
Information: The MIDS calculator assigns a default value of 0.06 inches per hour, equivalent to a D soil, to IR. This is based on the assumption that most water will drain to the underdrain, but that some loss to underlying soil will occur. A conservative approach assuming a D soil was thus chosen.
This equation assumes water will infiltrate through the entire side slope area during the period when water is being drawn down. This is not the case, however, since the water level will decline in the BMP. The MIDS calculator assumes a linear drop in water level and thus divides VU by 2.
Volume credit for media storage capacity below the underdrain (VU) is accounted for only if the underdrain is elevated above the native soils. Volume credit for media storage capacity below the underdrain is given by
$^V_U = (n-FC)\ D_U\ (A_U + A_B)/2 ^$
Where:
AB = surface area at the bottom of the media (square feet);
n = media porosity (cubic feet per cubic foot);
FC = the field capacity of the soil, in cubic feet per cubic foot; and
DU = the depth of media below the underdrain (feet).
This is an instantaneous volume. This will somewhat overestimate actual storage when the majority of water is being captured by the underdrains. This equation assumes water between the soil porosity (f) and field capacity will infiltrate into the underlying soil.
The volume of water lost through ET is assumed to be the smaller of two calculated values: potential ET and measured ET. Potential ET (ETpot) is equal to the amount of water stored in the basin between field capacity and the wilting point. Measured ET (ETmea) is the amount of water lost to ET as measured using available data and is assumed to be 0.2 inches/day. ETmea is converted to ET by multiplying by a factor of 0.5. ET is considered to occur over a period equal to the drawdown time of the basin. Volume credit for evapotranspiration is given by the lesser of
$^ET_{mea} = (0.2/12)\ A\ 0.5\ t \) \( ET_{pot} = D\ A\ C_S ^$
Where:
t = time over which ET is occurring (days);
D = depth being considered (feet);
A = area being considered (square feet); and
CS = soil water available for ET, generally assumed to be the water between field capacity and wilting point.
ET is likely to be greater if one or more trees is planted in the biofiltration basin. Planting a tree in a biofiltration system is HIGHLY RECOMMENDED. The MIDS calculator increases the above ET credit by a factor of 3 when a tree is planted in the bioretention basin.
Provided soil water (moisture) content is greater than the wilting point, ET will continually occur during the non-frozen period. However, because the above volume calculations are event based, t will be equal to the time between rain events. In the MIDS calculator, a value of 3 days is used because this is the average number of days between precipitation events. ET will occur over the entire media depth. D may therefore be set equal to the media depth (DM). In this case, the value for A would be the average area through the entire depth of the media. The MIDS calculator limits ET to the area above the underdrain. If infiltration is being computed through the bottom and sidewalls of the basin, then CS would be field capacity minus the wilting point of soils (cubic feet per cubic foot) since water above the field capacity would infiltrate (or go to an underdrain).
The volume of water passing through underdrains can be determined by subtracting the volume loss (V) from the volume of water instantaneously captured by the BMP. No volume reduction credit is given for filtered stormwater that exits through the underdrain, but the volume of filtered water can be used in the calculation of pollutant removal credits through filtration.
The volume reduction credit (V) can be converted to an annual volume if desired. This conversion can be generated using the MIDS calculator or other appropriate modeling techniques. The MIDS calculator obtains the percentage annual volume reduction through performance curves developed from multiple modeling scenarios using the volume reduction capacity for biofiltration, the infiltration rate of the underlying soils, and the contributing watershed size and imperviousness.
Total suspended solids credit calculations
TSS reduction credits correspond with volume reduction through infiltration and filtration of water captured by the biofiltration basin and are given by
$^M_{TSS} = M_{TSS_i} + M_{TSS_f} ^$
Where:
MTSS = TSS removal (pounds);
MTSS_i = TSS removal from infiltrated water (pounds); and
MTSS_f = TSS removal from filtered water (pounds).
Pollutant removal for infiltrated water is assumed to be 100 percent. The event-based mass of pollutant removed through infiltration, in pounds, is given by
- biofiltration: $^M_{TSS_i} = 0.0000624\ (V_{inf_b} + V_{inf_s} + V_U)\ EMC_{TSS} ^$
- bioinfiltration: $^ M_{TSS_i} = 0.0000624\ V_{WQ}\ EMC_{TSS}^$
Where:
EMCTSS is the event mean TSS concentration in runoff water entering the BMP (milligrams per liter).
The EMCTSS entering the BMP is a function of the contributing land use and treatment by upstream tributary BMPs. For more information on EMC values for TSS, link here or here. If there is no underdrain, the water quality volume (VWQ) is used in this calculation.
Removal for the filtered portion is less than 100 percent. The event-based mass of pollutant removed through filtration, in pounds, is given by
$^ M_{TSS_f} = 0.0000624\ (V_{total} - (V_{inf_b} + V_{inf_s} + V_U))\ EMC_{TSS}\ R_{TSS} ^$
Where:
Vtotal is the total volume of water captured by the BMP (cubic feet); and
RTSS is the TSS pollutant removal percentage for filtered runoff.
The Stormwater Manual and MIDS calculator provide a recommended value for RTSS of 0.80 (80 percent) removal for filtered water. Alternate justified percentages for TSS removal can be used if proven to be applicable to the BMP design.
The above calculations may be applied on an event or annual basis and are given by
$^ M_{TSS_f} = 2.72\ F\ V_{F_{annual}}\ EMC_{TSS}\ R_{TSS} ^$
Where:
F is the fraction of annual volume filtered through the BMP; and
Vannual is the annual volume treated by the BMP, in acre-feet.
Phosphorus credit calculations
Total phosphorus (TP) reduction credits correspond with volume reduction through infiltration and filtration of water captured by the biofiltration basin and are given by
$^M_{TP} = M_{TP_i} + M_{TP_f} ^$
Where:
MTP = TP removal (pounds);
MTP_i = TP removal from infiltrated water (pounds); and
MTP_f = TP removal from filtered water (pounds).
Pollutant removal for infiltrated water is assumed to be 100 percent. The mass of pollutant removed through infiltration, in pounds, is given by
- biofiltration: $^M_{TP_i} = 0.0000624\ (V_{inf_b} + V_{inf_s} + V_U)\ EMC_{TP}^$
- bioinfiltration: $^M_{TP_i} = 0.0000624\ V_{WQ} \ EMC_{TP} ^$
Where:
EMCTP is the event mean TP concentration in runoff water entering the BMP (milligrams per liter).
The EMCTP entering the BMP is a function of the contributing land use and treatment by upstream tributary BMPs.
The filtration credit for TP in bioretention with underdrains assumes removal rates based on the soil media mix used and the presence or absence of amendments. Soil mixes with more than 30 mg/kg phosphorus (P) content are likely to leach phosphorus and do not qualify for a water quality credit. If the soil phosphorus concentration is less than 30 mg/kg, the mass of phosphorus removed through filtration, in pounds, is given by
$^ M_{TP_f} = 0.0000624\ (V_{total} - (V_{inf_b} + V_{inf_s} + V_U))\ EMC_{TP}\ R_{TP}^$
Information: Soil mixes C and D are assumed to contain less than 30 mg/kg of phosphorus and therefore do not require testing
Again, assuming the phosphorus content in the media is less than 30 milligrams per kilogram, the removal efficiency (RTP) provided in the Stormwater Manual is a function of the fraction of phosphorus that is in particulate or dissolved form, the depth of the media, and the presence or absence of soil amendments. For the purpose of calculating credits it can be assumed that TP in storm water runoff consists of 55 percent particulate phosphorus (PP) and 45 percent dissolved phosphorus (DP). The removal efficiency for particulate phosphorus is 80 percent. The removal efficiency for dissolved phosphorus is 20 percent if the media depth is 2 feet or greater. The efficiency decreases by 1 percent for each 0.1 foot decrease in media thickness below 2 feet. If a soil amendment is added to the BMP design, an additional 40 percent credit is applied to dissolved phosphorus. Thus, the overall removal efficiency, (RTP), expressed as a percent removal of total phosphorus, is given by
$^R_{TP} = (0.8 * 0.55) + (0.45 * ((0.2 * (D_{MU_{max=2}})/2) + 0.40_{if amendment is used})) * 100^$
Where:
the first term on the right side of the equation represents the removal of particulate phosphorus;
the second term on the right side of the equation represents the removal of dissolved phosphorus; and
DMUmax=2 = the media depth above the underdrain, up to a maximum of 2 feet.
The assumption of 55 percent particulate phosphorus and 45 percent dissolved phosphorus is likely inaccurate for certain land uses, such as industrial, transportation, and some commercial areas. Studies indicate particulate phosphorus comprises a greater percent of total phosphorus in these land uses. It may therefore be appropriate to modify the above equation with locally derived ratios for particulate and dissolved phosphorus. For more information on fractionation of phosphorus in stormwater runoff, link here.
Example calculations for TSS and TP
Three examples are included based on the extent of infiltration occurring in the BMP. For each of these examples, assume 2.75 acre-feet of water is delivered to a bioretention BMP from 1 acre of impervious surface, the TSS concentration in runoff is 54.5 milligrams per liter, and the total phosphorus concentration is 0.30 milligrams per liter.
Example 1: Bioinfiltration (no underdrain)
Assume the bioinfiltration practice is designed to capture 90 percent of annual runoff, or 2.475 acre-feet. Multiply this by the concentration (0.3 or 54.5), a conversion factor of 0.0000624 to convert into pounds, and 43560 square feet to convert to cubic feet.
TSS: (0.9*2.75) x (54.5) x (0.0000624) x (43560) = 366.6 pounds
P: (0.9*2.75) x (0.3) x (0.0000624) x (43560) = 2.02 pounds
Example 2: Biofiltration with lined sides and bottom (i.e. no infiltration)
Assume the bioinfiltration practice is designed to capture 90 percent of annual runoff, or 2.475 acre-feet. Assume 1 foot of media, Mix C, above the underdrain and an iron amendment is added. For TSS, the removal efficiency is 85 percent for the water that is captured by the BMP. Since media mix C is used, phosphorus will be removed by the BMP. Calculations must be made for particulate (PP) and dissolved phosphorus (DP). PP accounts for 55 percent of the total phosphorus (TP) and DP for 45 percent of the TP. The removal efficiency for PP is 0.80 (80%) for the water captured by the BMP. For DP, the removal efficiency is 0.20 (20 percent) times the media depth divided by 2 (1/2 or 0.5), plus 0.40 (40 percent, which accounts for the amendment).
TSS: (0.8*0.9*2.75) x (54.5) x (0.0000624) x (43560) = 293.3 pounds
Phosphorus:
PP: (0.55*0.8*0.9*2.75) x (0.3) x (0.0000624) x (43560) = 0.888 pounds
DP: ((0.2*0.5*+0.4) x (0.45) x (2.75) x (43560) x (0.3) x (0.0000624)) = 0.454 pounds
TP: (0.888+0.454) = 1.342 pounds
Example 3: Biofiltration with unlined sides and bottom (i.e. some infiltration occurs)
To make this calculation, we need to know the percent of water that infiltrates and the percent that is captured by the underdrain. Note the volume infiltrated will need to be calculated using the methodology described above. To simplify the calculations in this example, assume 10 percent of the captured water infiltrates, while the remaining water goes to the underdrain.
TSS:
Infiltrated: (0.9) x (0.1) x (43560) x (2.75) x (54.5) x (0.0000624) = 36.7 pounds.
Note this is 10 percent of the volume calculated in Example 1.
Filtered (underdrain): (0.85) x (0.9) x (0.9) x (43560) x (2.75) x (54.5) x (0.0000624) = 280.5 pounds.
Note this is 90 percent of the TSS calculated in Example 2.
Total: 317.2 pounds
Phosphorus:
Infiltrated: (0.9)(0.1)(43560)(2.75)(0.3)(0.0000624) = 0.202 pounds. Note this is 10 percent of the volume calculated in Example 1.
Filtered (underdrain): This calculation is the same as for Example 2, corrected for only 90 percent of the volume being treated by filtration. (1.342) x (0.9) = 1.208 pounds
Total: 1.410 pounds
Other pollutants
In addition to TSS and phosphorus, bioretention BMPs can reduce loading of other pollutants. According to the International Stormwater Database, studies have shown that bioretention BMPs are effective at reducing concentrations of pollutants, including metals, and bacteria. A compilation of the pollutant removal capabilities from a review of literature are summarized below.
| Pollutant | Constituent | Treatment capabilities1 |
|---|---|---|
| Metals2 | Cadmium, Chromium, Copper, Zinc, Lead | High |
| Nitrogen2 | Total nitrogen, Total Kjeldahl nitrogen | Low/medium |
| Bacteria2 | Fecal coliform, e. coli | High |
| Organics | Petroleum hydrocarbons3, Oil/grease4 | High |
| 1 Low: < 30%; Medium: 30 to 65%; High: >65% 2 International Stormwater Database, (2012) 3 LeFevre et al., (2012) 4 Hsieh and Davis (2005). See Reference list |
||
Related pages
- Methods and resources for calculating credits
- Bioretention
- Bioretention terminology (including types of bioretention)
- Overview for bioretention
- Design criteria for bioretention
- Construction specifications for bioretention
- Operation and maintenance of bioretention
- Cost-benefit considerations for bioretention
- Soil amendments to enhance phosphorus sorption
- Summary of permit requirements for bioretention
- Supporting material for bioretention
- External resources for bioretention
- References for bioretention
- Requirements, recommendations and information for using bioretention with no underdrain BMPs in the MIDS calculator
- Requirements, recommendations and information for using bioretention with an underdrain BMPs in the MIDS calculator