Difference between revisions of "Minnesota Stormwater Manual email Updates"
| Line 83: | Line 83: | ||
The process of infiltration is not so simple. Below are some characteristics of infiltration and how they may affect the performance of a practice. Understanding these processes helps explain why stormwater practices may not perform as expected (either over- or under-perform). | The process of infiltration is not so simple. Below are some characteristics of infiltration and how they may affect the performance of a practice. Understanding these processes helps explain why stormwater practices may not perform as expected (either over- or under-perform). | ||
| − | *'''Steady-state vs. transient flow'''. When we size a practice we either measure the steady-state infiltration rate using devices such as a <span title="The permeameter is a laboratory tool to measure the saturated permeability, or K-factor, of soil samples."> '''permeameter'''</span> or double-ring infiltrometer, or we take soil borings to determine the soil texture and then assign an infiltration rate (see [[Design infiltration rates]]), which is typically the saturated <span title="Hydraulic conductivity is a property of soils and rocks that describes the ease with which a fluid (usually water) can move through pore spaces or fractures."> '''hydraulic conductivity (k)'''</span> for that soil texture. But soils are rarely saturated at the beginning of a rainfall/runoff event. Consequently some infiltration occurs prior to development of a <span title="The interface between soil that is unchanged from the initial state and the newly wetted zone from an infiltration or irrigation event."> '''wetting front'''</span> in a soil. The adjacent schematic indicates infiltration rates | + | *'''Steady-state vs. transient flow'''. When we size a practice we either measure the steady-state infiltration rate using devices such as a <span title="The permeameter is a laboratory tool to measure the saturated permeability, or K-factor, of soil samples."> '''permeameter'''</span> or double-ring infiltrometer, or we take soil borings to determine the soil texture and then assign an infiltration rate (see [[Design infiltration rates]]), which is typically the saturated <span title="Hydraulic conductivity is a property of soils and rocks that describes the ease with which a fluid (usually water) can move through pore spaces or fractures."> '''hydraulic conductivity (k)'''</span> for that soil texture. But soils are rarely saturated at the beginning of a rainfall/runoff event. Consequently some infiltration occurs prior to development of a <span title="The interface between soil that is unchanged from the initial state and the newly wetted zone from an infiltration or irrigation event."> '''wetting front'''</span> in a soil. The adjacent schematic indicates how infiltration rates vary with soil water (moisture) content. For more information on soil infiltration, see these sites. |
**[[Soil hydrologic properties and processes]] | **[[Soil hydrologic properties and processes]] | ||
**[[Determining soil infiltration rates]] | **[[Determining soil infiltration rates]] | ||
| + | **[https://www.mdpi.com/2076-3417/12/12/6185 Wetting Front Expansion Model for Non-Ponding Rainfall Infiltration in Soils with Uniform and Non-Uniform Initial Moisture Content] - Yao et. al, 2022. Appl. Sci. 12(12):6185. https://doi.org/10.3390/app12126185 | ||
*'''One-dimensional flow'''. In designing an infiltration practice we assume all water is transported vertically. Infiltration of course occurs in three dimensions. This increases the area over which infiltration is occurring. Thus, using the surface area of a practice to size a practice underestimates the actual area over which infiltration is occurring. Wetting fronts in sandy soils are more elongated compared to loams and clays. For more information, watch these videos and see the adjacent image. | *'''One-dimensional flow'''. In designing an infiltration practice we assume all water is transported vertically. Infiltration of course occurs in three dimensions. This increases the area over which infiltration is occurring. Thus, using the surface area of a practice to size a practice underestimates the actual area over which infiltration is occurring. Wetting fronts in sandy soils are more elongated compared to loams and clays. For more information, watch these videos and see the adjacent image. | ||
**[https://www.youtube.com/watch?v=ptBlPBK_Zxs The wetting front] | **[https://www.youtube.com/watch?v=ptBlPBK_Zxs The wetting front] | ||
**[https://www.youtube.com/watch?v=gYk07ZGZbqo Detecting the wetting front] | **[https://www.youtube.com/watch?v=gYk07ZGZbqo Detecting the wetting front] | ||
*'''Homogenous soils'''. We strongly recommend measuring infiltration rate in the field and taking multiple measurements. The reason is that soils are not homogenous. Ksat varies considerably over relatively short distances, even within an area having a single mapped soil unit. It is not uncommon for Ksat to vary by up to three orders of magnitude at a single development site ([https://www.sciencedirect.com/science/article/abs/pii/S0169555X1930251X], [https://www.researchgate.net/publication/256706850_Variability_of_hydraulic_conductivity_due_to_multiple_factors], [https://agupubs.onlinelibrary.wiley.com/doi/abs/10.1029/WR012i001p00078], [https://www.publish.csiro.au/sr/sr99091], [https://acsess.onlinelibrary.wiley.com/doi/abs/10.2136/sssaj1971.03615995003500050058x]). [https://www.researchgate.net/publication/256706850_Variability_of_hydraulic_conductivity_due_to_multiple_factors Deb and Schukla] (2012, free access) provide a nice discussion of saturated hydraulic conductivity. | *'''Homogenous soils'''. We strongly recommend measuring infiltration rate in the field and taking multiple measurements. The reason is that soils are not homogenous. Ksat varies considerably over relatively short distances, even within an area having a single mapped soil unit. It is not uncommon for Ksat to vary by up to three orders of magnitude at a single development site ([https://www.sciencedirect.com/science/article/abs/pii/S0169555X1930251X], [https://www.researchgate.net/publication/256706850_Variability_of_hydraulic_conductivity_due_to_multiple_factors], [https://agupubs.onlinelibrary.wiley.com/doi/abs/10.1029/WR012i001p00078], [https://www.publish.csiro.au/sr/sr99091], [https://acsess.onlinelibrary.wiley.com/doi/abs/10.2136/sssaj1971.03615995003500050058x]). [https://www.researchgate.net/publication/256706850_Variability_of_hydraulic_conductivity_due_to_multiple_factors Deb and Schukla] (2012, free access) provide a nice discussion of saturated hydraulic conductivity. | ||
| − | *'''Preferential flow'''. Preferential flow, often called short-circuiting, is the rapid movement of water and associated solutes in large soil pores (e.g. pores greater than 75 microns in diameter). For stormwater applications, macropore flow occurs primarily under saturated conditions since the rate of water delivery to a soil typically exceeds the soil infiltration rate, resulting in ponding. Soil microrelief can lead to locally saturated areas within a soil, initiating macropore flow in those areas. In soils with significant macroporosity, a high percentage of annual water and solute movement can occur within the macropores. Mechanisms of macropore development in infiltration bmps are not yet understood. For more information and links to references, [https://stormwater.pca.state.mn.us/index.php?title=Soil_hydrologic_properties_and_processes#Preferential_.28macropore.29_pore_flow_in_soil go here]. | + | *'''Preferential flow'''. Preferential flow, often called short-circuiting, is the rapid movement of water and associated solutes in soil. It is typically associated with transport in large soil pores (e.g. pores greater than 75 microns in diameter). For stormwater applications, macropore flow occurs primarily under saturated conditions since the rate of water delivery to a soil typically exceeds the soil infiltration rate, resulting in ponding. Soil microrelief can lead to locally saturated areas within a soil, initiating macropore flow in those areas. In soils with significant macroporosity, a high percentage of annual water and solute movement can occur within the macropores. Mechanisms of macropore development in infiltration bmps are not yet understood. For more information and links to references, [https://stormwater.pca.state.mn.us/index.php?title=Soil_hydrologic_properties_and_processes#Preferential_.28macropore.29_pore_flow_in_soil go here]. |
| + | :Preferential flow may also be associated with "fingering" in soil, which is the movement of water and solutes in high velocity zones of the soil. These zones are not specifically associated with macropores but instead result from variable characteristics in soil, such as non-uniform texture and areas of water-repellency. For a description of fingering in a sand, see [https://agupubs.onlinelibrary.wiley.com/doi/pdf/10.1029/97WR02407 Ritsema and Dekker, 1998]. | ||
*'''Time'''. Soil hydraulic properties change with time. There are two competing forces at work in an infiltration practice. First, water ponded in a practice exerts pressure on the underlying soil, resulting in some compaction at the soil surface. Counteracting this is the biologic activity in soil, including the impact of plant root growth, actions of soil invertebrates, and development of macropores in some practices. Unfortunately, there are few long-term studies of infiltration rates in stormwater infiltration bmps. Limited studies of systems, such as those conducted over a 5 year period, indicate hydrologic performance in infiltration practices is maintained if the practice was properly designed, constructed, and maintained. Similarly, more work is needed to understand seasonal changes in infiltration, which have been observed in studies conducted at Villanova University. | *'''Time'''. Soil hydraulic properties change with time. There are two competing forces at work in an infiltration practice. First, water ponded in a practice exerts pressure on the underlying soil, resulting in some compaction at the soil surface. Counteracting this is the biologic activity in soil, including the impact of plant root growth, actions of soil invertebrates, and development of macropores in some practices. Unfortunately, there are few long-term studies of infiltration rates in stormwater infiltration bmps. Limited studies of systems, such as those conducted over a 5 year period, indicate hydrologic performance in infiltration practices is maintained if the practice was properly designed, constructed, and maintained. Similarly, more work is needed to understand seasonal changes in infiltration, which have been observed in studies conducted at Villanova University. | ||
Revision as of 14:19, 15 November 2022
Over the past several years we've heard from people suggesting they be notified when updates are made to the Minnesota Stormwater Manual. We have also identified several stormwater management concerns and felt that focused communication on these specific issues might be useful. We therefore decided that periodic emails to subscribers would be one way of notifying practitioners about updates to the Manual and focus on specific stormwater issues. Emails are sent periodically, roughly every 6-12 weeks.
The emails contain only a short description of updates and other information. This page provides more detailed information. It is organized by the approximate dates when emails are sent to subscribers. We welcome recommendations for featured topics and links to case studies and other items of information. Please contact Mike Trojan at the MPCA..
Subscribe to the email list here.
November 2022
We never got around to emailing an update in July, 2022, as we had planned. You can see what we did write in July, 2022 here.
Since our last email was 9 months ago, we have a lot of updates, so we'll try to be brief here and instead direct you to websites where you can get more information.
Updates to the wiki
Here is a summary of recent updates to the wiki.
- TP and TSS credits and guidance for manufactured treatment devices (mtds)
- Guidance and recommendations for storing transported snow and for on-site snow storage
- Operation and maintenance considerations for vegetation in stormwater management
- Assessing the performance of iron enhanced sand filter
- Identifying and characterizing redoximorphic features in soils and soil borings
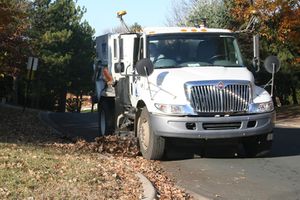
- Street sweeping updates
- Overview, water quality benefits, and other co-benefits of street sweeping
- Recommended practices for a water quality-targeted street sweeping program
- File:Fact sheet - recommended practices for a water quality targeted street sweeping program.docx
- Composition, characterization, and management of street sweepings
- Accounting for phosphorus load reductions with street sweeping
- Cost and maintenance information for street sweeping for water quality
- Street Sweeping Phosphorus Credit Calculator
- Green infrastructure updates
- Operation and maintenance of green stormwater infrastructure best management practices
- Planning green stormwater infrastructure projects and practices
- Green infrastructure and green stormwater infrastructure terminology
- Green Infrastructure benefits of bioretention
- Green Infrastructure benefits of tree trenches and tree boxes
- Green Infrastructure benefits of permeable pavement
- Green Infrastructure benefits of constructed wetlands
- Green Infrastructure benefits of vegetated swales
- Green Infrastructure benefits of harvest and use/re-use practices
- Green Infrastructure benefits of green roofs
What we are working on
- Street sweeping: We continue to work on street sweeping. In addition to the updates provided above, here are on-going activities.
- We are collaborating with the University of Minnesota Water Resources Center to develop a Clean Sweep Education & Training Program to assist local communities in implementing and enhancing their street sweeping programs to help meet water quality goals. The first street sweeping workshop was offered on September 27, 2022, at Forest Lake. The next Street Sweeping Workshop will be offered at Prior Lake, MN in March or April 2023.
- We continue to work with our contractor, Tetra Tech, on materials related to sweeping. Below are on-going tasks. For more detailed descriptions of the tasks, see this Word document: File:Sweeping WORK ORDER updates.docx.
- Develop a User Guide (How-to-Guide) listing and describing low-cost, simple tracking options for street sweeping
- Summarize disposal options for street sweeping materials based on information from existing street sweeping case studies, from a survey by the MPCA on managing sweeping waste, and from the literature
- Provide information on sweeper cost and maintenance
- BMP Report on Construction Stormwater Sediment Control from Pavement Sweeping
- Conduct a literature review on volume-mass relationships for street sweeping, with the intention of incorporating this into the Sweeping Calculator tool
- Iron enhanced sand filters. Dr. John Gulliver is leading a research study on pollutant removal in iron-enhanced sand filters. A website summarizing this research is not yet posted on the Minnesota Stormwater Research Council website. In brief, researchers will be monitoring iron-enhanced sand filters to determine what factors affect performance. Results from this work will be used to improve design, construction, and O&M information in the Minnesota Stormwater Manual. We are wrapping up a work order with Respec to develop information on Assessing the performance of iron enhanced sand filter.
- Sand filters. We created a separate section in the Manual addressing sand filters. We executed a work order with Respec to update guidance on operation and maintenance of sand filters. This work includes the following tasks. For more detailed description of tasks see this document: File:Sand filter WORK ORDER updates.docx.
- Provide an Overview of typical O&M
- Provide information on Design phase O&M considerations
- Provide information on Construction phase O&M considerations
- Provide information on Post-construction phase O&M considerations
- Provide information on Maintenance costs
- Provide links to Useful resources
- Green infrastructure. We continue to build information on green stormwater infrastructure into the wiki. We executed a contract with Limno Tech which includes the following tasks. For more detailed description of these tasks see this document: File:GSI WORK ORDER updates.docx.
- Create a planning section for implementing GI practices in the Stormwater Manual
- Identify the role of GSI in climate mitigation and climate adaptation (climate resilience)
- Provide information on potential impacts GSI has on climate resiliency
- In addition to the above contract work we continue to build information, in-house, on multiple benefits of green stormwater infrastructure. See this page for more information.
- Manufactured treatment devices (mtds). We contracted with Respec to develop an Excel spreadsheet to calculate annual stormwater runoff volume treated by mtds based on mtd sizing inputs
- Vegetation
- We are collaborating with Metro Blooms and the Board of Soil and Water Resources on updating the Blue Thumb Plant Selection tool currently on the web. The updates will focus on adding stormwater selection criteria to the tool to aid in incorporating appropriate vegetation into stormwater practices and projects. This project is funded through the Minnesota Stormwater Research Council and the project is not yet posted on their website, but check back in the future for detailed information on this project.
- We have contracted with LimnoTech to provide information on the following two tasks. For more detailed description of these tasks see this document: File:GSI WORK ORDER updates.docx.
- Provide information and materials for the Minnesota Stormwater Manual that support the Plant Selection Tool being developed by Metro Blooms
- Provide guidance and recommendations for establishing perennial vegetation cover at construction sites
Featured article - understanding the process of infiltration
Apologies for the long article, but hopefully you'll find it informative and useful.
In the Minnesota Stormwater Manual we have dedicated a considerable amount of time and resources to the topic of infiltration. At the end of this article are some of the many pages containing information on this topic. Considering the energy expended on this topic, we've perhaps not spent enough time drilling into the process of water infiltration into soil. So put on your physics cap.
In the context of stormwater, infiltration is simply the movement of water through soil or engineered media within a stormwater practice ( best management practice) and into the underlying soil, vadose zone, and potentially groundwater. Infiltration occurs in nearly all stormwater practices, even those employing liners, since liners are not impermeable - they just have very slow infiltration rates. But even in filtration practices such as bioretention with an underdrain ( biofiltration), annual losses of water to infiltration commonly exceed 5 percent and often reach into the teens of percentages (determined from MIDS Calculator modeling).
Here we are concerned only with practices designed to infiltrate stormwater runoff. For a discussion of these practices, see Stormwater infiltration Best Management Practices and BMPs for stormwater infiltration. These practices are the focus of this discussion because they are designed (sized) to capture and infiltrate a specified amount of stormwater runoff, typically called a performance goal. Example performance goals are the 1 inch requirement in the Construction Stormwater General Permit and the 1.1 inch goal for Minimal Impact Design Standards. In sizing these practices, we typically configure the practice surface area and depth to instantaneously capture the performance goal ( instantaneous volume), often called the kerplunk method or estimation. For example, to meet a 1 inch performance goal from one acre of impervious surface, we "kerplunk" 3630 cubic feet of water into the practice, then sit back and expect it to infiltrate within 48 hours (or 24 hours in some cases). We base this expectation on the properties of the soil into which the water infiltrates.
The process of infiltration is not so simple. Below are some characteristics of infiltration and how they may affect the performance of a practice. Understanding these processes helps explain why stormwater practices may not perform as expected (either over- or under-perform).
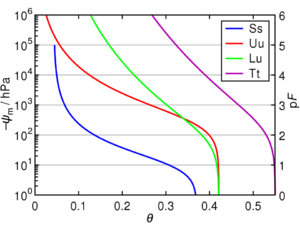
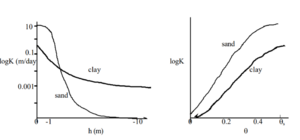
- Steady-state vs. transient flow. When we size a practice we either measure the steady-state infiltration rate using devices such as a permeameter or double-ring infiltrometer, or we take soil borings to determine the soil texture and then assign an infiltration rate (see Design infiltration rates), which is typically the saturated hydraulic conductivity (k) for that soil texture. But soils are rarely saturated at the beginning of a rainfall/runoff event. Consequently some infiltration occurs prior to development of a wetting front in a soil. The adjacent schematic indicates how infiltration rates vary with soil water (moisture) content. For more information on soil infiltration, see these sites.
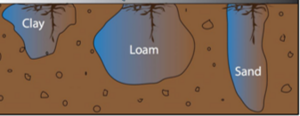
- One-dimensional flow. In designing an infiltration practice we assume all water is transported vertically. Infiltration of course occurs in three dimensions. This increases the area over which infiltration is occurring. Thus, using the surface area of a practice to size a practice underestimates the actual area over which infiltration is occurring. Wetting fronts in sandy soils are more elongated compared to loams and clays. For more information, watch these videos and see the adjacent image.
- Homogenous soils. We strongly recommend measuring infiltration rate in the field and taking multiple measurements. The reason is that soils are not homogenous. Ksat varies considerably over relatively short distances, even within an area having a single mapped soil unit. It is not uncommon for Ksat to vary by up to three orders of magnitude at a single development site ([1], [2], [3], [4], [5]). Deb and Schukla (2012, free access) provide a nice discussion of saturated hydraulic conductivity.
- Preferential flow. Preferential flow, often called short-circuiting, is the rapid movement of water and associated solutes in soil. It is typically associated with transport in large soil pores (e.g. pores greater than 75 microns in diameter). For stormwater applications, macropore flow occurs primarily under saturated conditions since the rate of water delivery to a soil typically exceeds the soil infiltration rate, resulting in ponding. Soil microrelief can lead to locally saturated areas within a soil, initiating macropore flow in those areas. In soils with significant macroporosity, a high percentage of annual water and solute movement can occur within the macropores. Mechanisms of macropore development in infiltration bmps are not yet understood. For more information and links to references, go here.
- Preferential flow may also be associated with "fingering" in soil, which is the movement of water and solutes in high velocity zones of the soil. These zones are not specifically associated with macropores but instead result from variable characteristics in soil, such as non-uniform texture and areas of water-repellency. For a description of fingering in a sand, see Ritsema and Dekker, 1998.
- Time. Soil hydraulic properties change with time. There are two competing forces at work in an infiltration practice. First, water ponded in a practice exerts pressure on the underlying soil, resulting in some compaction at the soil surface. Counteracting this is the biologic activity in soil, including the impact of plant root growth, actions of soil invertebrates, and development of macropores in some practices. Unfortunately, there are few long-term studies of infiltration rates in stormwater infiltration bmps. Limited studies of systems, such as those conducted over a 5 year period, indicate hydrologic performance in infiltration practices is maintained if the practice was properly designed, constructed, and maintained. Similarly, more work is needed to understand seasonal changes in infiltration, which have been observed in studies conducted at Villanova University.
So what does all this mean when designing an infiltration system? Some possible take-home messages include the following.
- Properly designed, constructed, and maintained practices typically "overperform"; that is, they capture and infiltrate more water than expected based on design.
- Field measurement of soil infiltration is highly recommended
- We need to better understand the role of biologic activity in soil infiltration. The engineered media and vegetation in a stormwater bmp may significantly affect performance of the practice, particularly over time. Similarly, maintenance activities affect soil hydrologic properties, particularly maintenance activities that modify soil structure (e.g. tilling, incorporation of organic matter).
To better understand some of these principles in stormwater applications, we recommened A new dynamic horizon in stormwater, presented by Dr. Bridget Wadzuk at the Minnesota Seminar and Spotlight Series.
Suggested pages in the Minnesota Stormwater Manual
In the News - What we're reading
- FUNDING, SOURCE CONTROL TOP 2022 LIST OF STORMWATER LEGISLATIVE PRIORITIES: WEF Stormwater Report
- Research finds three main attitudes to improving stormwater management: Stormwater
- Meaningful Mitigation - Green infrastructure provides simple changes that can transform the feel of community while improving the resiliency of an urban city design: Stormwater
- California could shrink water use in cities by 30% or more, study finds: Phys.org
- Stormwater harvesting device benefits urban street trees: Phys.org
Take the infiltration quiz
July 2022
Although it has been several months since the last update to the Stormwater Manual wiki, we have not added a lot of new material. However, we are beginning a review and reorganization process for the wiki.
Updates to the Manual wiki (July 2022)
- Planning green stormwater infrastructure (GSI) projects and practices: We continue to add information to the green infrastructure section of the manual. A new page called Planning green stormwater infrastructure projects and practices was created. The page provides information on how to plan for incorporating GSI into new development and retrofit projects. Several links are included, including links to ordinances, checklists for identifying barriers to implementing GSI, planning case studies, cost information, potential funding sources, and more.
- Operation and maintenance considerations for vegetation in stormwater management: We've begun incorporating information on vegetation into the manual. A recently created page called Operation and maintenance considerations for vegetation in stormwater management provides information on establishing vegetation at a site and creating a vegetation management plan. This page is still under review.
- Stormwater wiki reorganization: The wiki has over 2000 pages and over 1500 images. It has become disorganized. We've begun the process of evaluating a better structure for organizing the content. This process will include deleting several hundred pages and condensing information. We hope to have a draft structure within the next month or two.
- Stormwater wiki page updates: We are in the process of going through every page in the wiki. Revised pages will include updating links, updating information as needed, providing definitions where appropriate using hover boxes, improving tables and visuals if appropriate, and creating pdfs of most pages. Some pages may contain video summaries. Remember that pdfs are static. To see when the last update occurred, scroll to the bottom and view the date of the last update or go to the Page Information link in the left toolbar.
What are we working on (July 2022)
- Continue reorganizing the wiki and updating pages over the next 9 months
- Create new content on street sweeping. We are working with the University of Minnesota to develop content focusing on establishing a street sweeping program for water quality purposes. New material will include
- Iron-enhanced sand filters
- Vegetation
- Green infrastructure
Featured article - Green stormwater infrastructure and alphabet soup (July 2022)
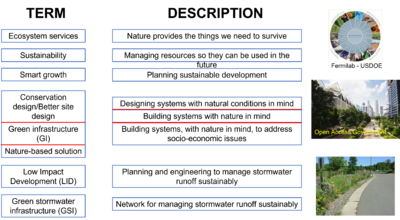
We are continually bombarded with new terminology and acronyms. These days, an important focus of stormwater is green infrastructure, anture-based solutions, and sustainability. What do these mean and is it important to know the distinction between these?
To begin, there is no universal definition of these. So this featured article provides our view on this topic. If you want some basic definitions, we have a page called Green infrastructure and green stormwater infrastructure terminology.
The core concept is that we receive all our resources, needs, and provisions from nature. Examples include clean air and water, nutrient cycling, pollination, and minerals. These may become depleted or impaired as we utilize these ecosystem services, making them unavailable for future generations. This is not sustainable, since at some point lack of one or more ecosystem services will make life untenable. To become sustainable, we must utilize ecosystem services in a way that keeps them useable into the future.
One way to achieve sustainable development is to design and build systems that mimic nature. This is done by conserving resources or engineering systems that retain or simulate natural processes. These systems include transportation, buildings, utilities, air and water management, waste management, and so on. Concepts incorporating these different features typically occur at the watershed, city, or large development scale and include the following.
- Large scale design (e.g. city, watershed)
- Small- and medium scale design (sub-watershed, large development): Better Site Design, Conservation Design
- Built: Green infrastructure, Nature-based solutions
Stormwater is one factor to consider in sustainable development.
- Planning stormwater management: Low Impact Development (infiltration, underground storage/retention)
- Built stormwater management: Green stormwater infrastructure (e.g. bioretention, permeable pavement, green roofs)
In the news and events (July, 2022)
Take the vegetation quiz
February 2022
It's been several months since our last update, as we were wrapping up a number of projects.
Updates to the Manual (February 2022)
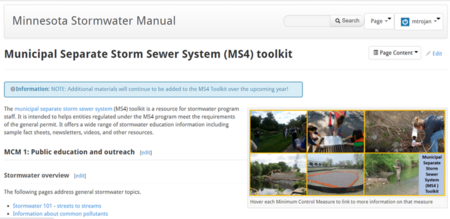
- Stormwater MS4 toolkit. The MS4 (Municipal Separate Storm Sewer System) toolkit is a resource for local stormwater program staff. It is intended to help entities regulated under the MS4 program meet the requirements of the general permit. It offers a wide range of stormwater education information including sample fact sheets, newsletters, videos, and other resources. The toolkit was recently updated with information on stormwater management, including new videos. To see the new information, visit this page.
- Street sweeping: We continue to update information on street sweeping. Below is a summary of the latest updates.
- Recommended street sweeping practices for water quality purposes: This page includes a summary of recommended practices at the top of the page.
- Case studies for street sweeping: In December we conducted interviews with staff from seven cities that were implementing street sweeping for water quality purposes. The interviews illustrate how cities are modifying their sweeping efforts to enhance water quality objectives. Information from these interviews was used to develop the recommended practices mentioned in the previous bullet.
- Street Sweeping Phosphorus Credit Calculator How-to-Guide: This handy quick guide summarizes how to use the street sweeping calculator.
- What's next: We plan on meeting with several stakeholders to identify additional tools and resources they would like to help continue enhancing street sweeping for water quality. Following this meeting, we will determine what tools and resources we can produce. These will be incorporated into the Stormwater Manual as appropriate and further communicated through other means such as newsletters.
- We have developed total suspended solid (TSS) and total phosphorus (TP) credits for manufactured treatment devices (mtds). These credits represent the reduction in TSS or TP loading expressed as a percent for water treated by the device. There are additional needs for crediting mtds, including the following.
- Calculation of annual load reductions. The credits established for mtds only represent the percent reduction for water treated by a device. The volume of water treated by a device, typically expressed on an annual average basis, must be determined before calculating an annual pollutant reduction for the device.
- Credits for dissolved phosphorus (DP). TP credits are currently limited based on the assumption the devices are not removing dissolved phosphorus. The credit scheme includes three tiers. Tier 3 will include credits for removing DP. Before Tier 3 credits can be determined, however, we must develop methods for calculating the performance of a device with respect to DP. Ultimately, DP credits may be given for devices that have a mechanism for removing DP (e.g. an amendment) or that retain runoff water (e.g. through infiltration).
- Time frame: We anticipate completing guidance for calculating annual loads and for assigning Tier 3 credits by this summer.
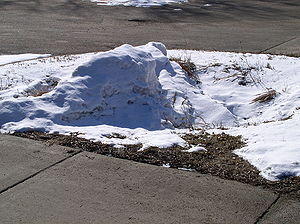
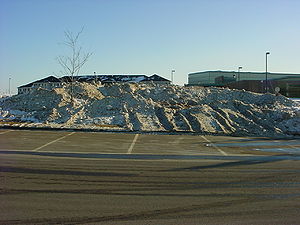
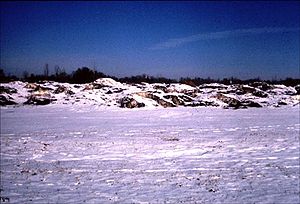
- We created a page called Guidance and recommendations for storing transported snow and for on-site snow storage. This page provides recommendations for managing and storing snow, including information for snow collected from impervious surfaces and transported to a storage location as well as information on storing snow on-site. The recommendations focus on protection of surface waters (lakes, rivers, wetlands), except where otherwise noted. The page is largely populated but will be undergoing some additions in February, 2022.
What are we working on (February 2022)
- Iron enhanced sand filters. In 2019 we compiled a spreadsheet containing information on 166 iron-enhanced sand filters (IESFs) in Minnesota. At the time there was limited performance information for these bmps. We have executed a work order to revisit a subset of these bmps and analyze their performance. The resulting information will be used to update guidance on design, construction, operation, and maintenance of IESFs. Projected timeline - late summer 2022.
- Vegetation: We have created a new page in the wiki called Plant and vegetation information for stormwater management. This page provides a framework for information on plants and vegetation that will eventually be incorporated into the wiki. We have a current work order to develop information on site assessment, preparation, design considerations and recommendations for vegetation in stormwater management and on operation and maintenance considerations for vegetation in stormwater management. We anticipate this information will be available in late summer, 2022.
- Green infrastructure: A long-term project to improve information on Green Stormwater Infrastructure in the Manual started in 2021. This work will be completed in phases. A current work order addresses design considerations for green stormwater infrastructure best management practices. We anticipate this work being completed by late summer, 2022.
- Street sweeping: The MPCA is working with University of Minnesota Extension staff to identify tool and resource needs to promote street sweeping.
- Management and disposal of bioretention media. In spring, 2022, we anticipate having guidance on how to evaluate and manage bioretention media at the end of its life cycle.
Featured article - Managing chloride in stormwater runoff (February 2022)
It is widely acknowledged the most effective strategy for protecting receiving waters from chloride pollution is by reducing use of chloride-deicers. But elimination of deicers is not practical in the foreseeable future. Are there ways to manage urban runoff having elevated chloride concentrations?
A workgroup of stormwater and groundwater professionals recently produced a white paper, published by the Minnesota Groundwater Association, that addresses this topic. The paper, titled Impacts of Stormwater Infiltration on Chloride in Minnesota Groundwater, provides a discussion of chloride in stormwater runoff and potential groundwater impacts associated with infiltration of stormwater runoff.
Chloride concentrations in stormwater runoff are highly variable and seasonally dependent. Concentrations in winter range from several hundred mg/L to as high as 40,000 mg/L, with typical concentrations being closer to 1000 mg/L. Concentrations outside the deicing season are typically less than 50 mg/L, with concentrations decreasing from spring into fall. Chloride is toxic to aquatic life, with the aquatic life standard being 230 mg/L. The drinking water standard is based on taste and is 250 mg/L. Chloride is also toxic to vegetation, can corrode materials, and can inhibit lake mixing, which may in turn result in changes in phosphorus cycling.
Though chloride is not retained in soil, studies indicate it is attenuated in soil. As a result, there is a lag time between chloride entering soil, including a media-based stormwater best management practice, and its eventual movement to a receiving water, be that a lake, stream, river, or aquifer. Understanding this process and the eventual receiving water can help us manage runoff containing chloride. The white paper provides the following conclusions.
- Where deicer use is not extensive, infiltration practices are protective of receiving surface waters. Infiltration may increase groundwater chloride concentrations, but not to concerning levels. In some cases, infiltration may offset other chloride sources (e.g. leaking infrastructure) and lead to water quality improvements.
- Where deicing is extensive, infiltration practices will likely lead to criteria exceedances in shallow groundwater. This chloride-enriched groundwater may migrate to local streams or drinking water aquifers.
- In baseflow-fed urban streams impaired by high winter chloride concentrations, infiltration practices may decrease instream winter concentrations through dilution. In-stream summer concentrations will be a function of concentrations in groundwater. If groundwater exceeds the aquatic life standard of 230 mg/L, baseflow-fed summer stream concentrations may exceed the standard.
The white paper also provides several recommendations for managing stormwater runoff that contains elevated concentrations of chloride.
- Develop a method to assess shallow groundwater vulnerability to chloride contamination, which include geologically-based aquifer vulnerability factors and deicing information, for which road density or percent imperviousness can be suitable surrogates.
- Use the aforementioned method to identify and map shallow groundwater vulnerable to chloride contamination.
- Encourage proper stormwater infiltration where appropriate.
- Infiltrate in areas not vulnerable to chloride contamination.
- In areas vulnerable to chloride contamination, distribute infiltration rather than focusing on a single location.
- Properly site infiltration practices with respect to receptors (e.g., lakes, streams, and shallow drinking water wells). For example, locate an infiltration practice within 4-8 months travel time from a baseflow influenced receiving stream to offset peak winter in-stream concentrations.
- Because permeable pavements require little or no deicing, encourage them for infiltration in suitable locations (e.g., walkways, driveways), particularly where deicing is common.
- Do not store snow in infiltration practices or in practices that will receive runoff from melting snow piles, unless the practice is offline (i.e. runoff does not enter the practice and instead bypasses it during snowmelt).
When snowmelt runs off from a surface or snow storage area, routing the meltwater across a permeable surface allows some infiltration and may slow the rate of delivery to the conveyance system. This may spread the delivery of chloride-rich water to receiving waters and smooth the peaks in chloride concentration in the receiving water.
In the news and events (February, 2022)
- RESEARCHERS PROPOSE NEW DEFINITION FOR GREEN INFRASTRUCTURE. You may have noticed we use the term Green Stormwater Infrastructure in this manual. This is because Green Infrastructure includes non-stormwater activities and practices and addresses topics such as human and ecological benefits. This article provides a brief overview of a study What is green infrastructure? A study of definitions in US city planning, published in Frontiers in Ecology and the Environment (January, 2022). The study shows that even within the stormwater community, much of the focus is on hydrologic aspects of stormwater. Thus, for example, permeable pavement is often identified as an important green infrastructure practice, though it has limited benefits beyond water quality and volume reduction.
- Build Back Better. We've been hearing this for some time now, with little apparent progress toward final legislation. There is no shortage of articles and information on this proposed legislation and what it means for stormwater and water in general. This article provides a general overview of what was in the original proposal, indicating nearly 2 billion dollars were to be dedicated to rebuilding water infrastructure. Here are additional articles if interested in this topic: [6], [7], [8], and [9]. Will a bill get passed? If so, what will the implications be for stormwater?
- Urban Greening ‘Not A Panacea' For Dealing With Extreme Weather, Study Finds. The authors summarize a study (Cuthbert et al., 2022) pointing out that green stormwater infrastructure is just one piece of the urban hydrology puzzle. By itself, it cannot simultaneously solve issues of flooding and heat island mitigation.
- LOCALLY: The Doc is leaving the house. Mississippi Watershed Management Organization (MWMO) Executive Director Doug Snyder will retire at the end of February 2022, after nearly 20 years of service at the MWMO. We'll miss you Doug.
- Events: For a full list of events, see this link. Here are some events of interest.
- U of MN P8 training on the use of the P8 software. P8 is a free software package for modeling stormwater pollutant management in urban watersheds. This training will be offered online through zoom in the afternoons of March 2 and March 3, with a short session on February 23 to confirm software installation and access. For more information on this training, go to this link.
- International Erosion Control Association Annual Conference, Minneapolis, MN, February 15-18, 2022
- Water Resources Conference, October 18-19, 2022
Take the chloride/deicer quiz
September 2021
Updates to the Manual (September 2021)
- Operation and maintenance (O&M) of green stormwater infrastructure practices. We've reorganized and enhanced information on O&M for 8 practices. Each of these pages has a consistent format which we feel is more accessible than the previous O&M sections. Included are tables with maintenance schedules and troubleshooting guidance. There is better access to resources such as inspection sheets and maintenance agreements. Finally, each page, except wetlands, links to another page providing supplemental O&M information.
- Operation and maintenance of bioretention and other stormwater infiltration practices
- Operation and maintenance (O&M) of tree trenches and tree boxes
- Operation and maintenance (O&M) of green roofs
- Operation and maintenance (O&M) of swales
- Operation and maintenance (O&M) of filter strips
- Operation and maintenance (O&M) of stormwater and rainwater harvest and use/reuse practices
- Operation and maintenance (O&M) of stormwater treatment wetland practices
- Operation and maintenance (O&M) of permeable pavement
- Recommended street sweeping practices for water quality purposes. This page provides guidance to instruct users on best practices associated with street sweeping and provide the user with key information and resources to successfully develop and execute a street sweeping program. This guidance is intended to aid in the understanding of street sweeping, its benefits, and links to a variety of helpful resources for a municipality seeking to review or develop its own street sweeping program. Topics include the following.
- Information on soils. This is a work in progress, but we have created and populated several pages on soil-related topics. Included are pages on soil physical, chemical, biologic, and hydrologic properties; information on soil measurements such as measuring infiltration rates; assessing soil health; tables with values for different soil properties; and links to resources. Visit the soil Table of Contents to see the topics covered.
What are we working on (September 2021)
- Street sweeping
- Case studies. We will be conducting interviews with a variety of entities that conduct street sweeping. An important goal of this is to develop guidance for how to establish sweeping programs targeted to water quality improvement.
- Communication plan. We will complete a communication plan designed to disseminate information on street sweeping and application of the recently developed sweeping credit and sweeping guidance.
- Vegetation. We have a work order in place and have communicated with a stakeholder team about improving information on vegetation in the manual. The team identified the following as top priorities in moving forward.
- Site assessment, preparation, design considerations, and recommendations for vegetation in stormwater management
- Plant and seed selection based on project goals and site conditions
- Design phase O&M
- Manufactured treatment devices (mtds). MTDs are pre-fabricated stormwater treatment structures utilizing settling (sedimentation), filtration, absorptive/adsorptive materials, vortex separation, vegetative components, and/or other appropriate technology to remove pollutants from stormwater runoff. We are in the process of developing phosphorus and TSS pollutant removal credits for these practices. A workgroup will be reviewing the draft credits in the coming weeks.
- Continue working on soil information and media.
Featured article (September 2021)
The MIDS Calculator and MPCA Simple Estimator
The Minimal Impacts Design Standards (MIDS) Calculator and MPCA's Simple Estimator (Estimator) are two tools used to estimate volume and pollutant load reductions associated with implementation of stormwater control measures, also known as best management practices (BMPs). Each of these tools is widely used. The MIDS Calculator, for example, has had over 8000 downloads in the past 3 years, while the Estimator is used by many MS4 permittees to assess progress toward or determine if they are meeting a TMDL Wasteload Allocation. The advantage of these tools is they are relatively easy to use and understand. However, with simplicity comes the potential for inaccuracy. This article provides a high level discussion of these two tools, including their advantages and potential pitfalls. The closing paragraph in this article provides a discussion of how MPCA hopes to move forward in providing a better understanding and application of these tools.
MIDS Calculator
The MIDS Calculator was originally designed as a tool for determining how to meet the MIDS performance goal of 1.1 inches at development sites. Detailed discussion of the Calculator and MIDS performance goal are found on the following pages.
- Recommendations and guidance for utilizing the MIDS calculator to meet TMDL permit requirements
- MIDS calculator
- Case study for using the MIDS calculator to meet TMDL permit requirements
- Performance goals for new development, re-development and linear projects
Despite the original intent, the Calculator is being used for purposes other than assessing volume reduction at individual sites. It was and continues to be widely used for water quality determinations, including at sub-watershed scales. This presents a number of challenges since the Calculator is not easily modified or is inflexible in addressing water quality at these larger scales. Examples of some limitations of the Calculator include the following.
- The Calculator uses a single value for event mean concentration that must be applied across the entire project.
- The Calculator has default ratios for particulate phosphorus (PP) and dissolved phosphorus (DP) as a fraction of total phosphorus (0.55 for PP and 0.45 for DP).
- Pollutant removal efficiencies of BMPs cannot be modified.
- Bypass is not easily addressed.
These are just examples of limitations.
Fundamentally, the MIDS Calculator is limited by its platform. It is built in Excel and addressing these various issues would be challenging. Additionally, as these issues get addressed, the tool becomes more complex to use, defeating one of its original intentions.
MPCA Simple Estimator
The 2013 MS4 permit required quantification of pollutant reductions to demonstrate a permittee was making progress toward achieving or had achieved a TMDL ( total maximum daily load) wasteload allocation. The tools available, such as P8, WinSLAMM, SWMM, and even the MIDS Calculator, were accessible only to "modeling experts". As a result, the MPCA developed a simple Excel spreadsheet that employed the Simple Method. This spreadsheet was readily accessible to most practitioners and could be used to demonstrate progress toward meeting a WLA.
The tool was intended to be used for demonstrating progress toward reducing pollutant loads, since it only considered a single watershed and there was limited guidance on modifying defaults in the spreadsheet. To make the tool more robust and rigorous, the Excel workbook was updated to include up to 10 subwatersheds (as separate worksheets), default values were updated based on literature reviews, and guidance for using the tool was expanded. The tool was again widely used by permittees during the 2020-21 permit cycle. Questions and submittals we received indicated the tool continues to have limitations and is not being correctly applied in some situations. Some of the limitations in the tool include the following.
- The Estimator does not easily address treatment trains. The user must manipulate the model inputs to account for treatment within treatment trains.
- While the Estimator allows the user to account for reductions from non-structural practices, there is limited guidance on how reductions for these practices should be addressed in the workbook.
- Guidance on adjusting event mean concentrations and runoff coefficients is limited.
- Clearer guidance and training is needed for adjusting pollutant removal within individual practices.
Addressing these issues
MPCA hopes to conduct a more rigorous analysis of how these tools are being used and develop appropriate guidance. Additional training is likely. The Estimator may undergo modifications based on this analysis. Unfortunately, changes to the MIDS Calculator are unlikely as the Excel platform is limiting in terms of adjusting the Calculator for water quality modeling. We are in the process of documenting some of these issues and hope to have more detailed guidance and training in place in 2022.
Alternative models may be used. The Minnesota Stormwater Manual provides a detailed summary of available water quality models. These models typically require greater modeling expertise and lack extensive documentation in the Manual, though many have user guides. The MPCA will also accept other modeling approaches, but it is recommended that permittees consult the MPCA prior to using alternative models.
Some other stuff of interest (September 2021)
- DONEUX DISCUSSES INNOVATION, OUTREACH, AND MS4 AWARDS - Yes, THE Mark Doneux in an interview featured in the WEF Stormwater Report
- Making Green Infrastructure Work: Lessons Learned from Towerside’s District Stormwater System
- MAYORS ON SIX CONTINENTS PROMISE GREEN INFRASTRUCTURE INVESTMENTS - WEF Stormwater Report
- Stormwater newsletters
- On-going webinar series
- Stormwater research
- Events
Take the green infrastructure O&M quiz
June 2021
Updates to the Manual (June 2021)
- Street sweeping: For the past two years we have been working with U of MN researchers and our contractor to develop a calculator to estimate phosphorus reductions associated with street sweeping. The calculator, a simple Excel workbook, is now available, along with a User Guide. Phosphorus crediting is based on measurements of sweeping material collected (wet or dry mass, or organic matter content). Standard Operating Procedures have also been developed. On May 13, we held a webinar that included an overview of the calculator, guidance, and presentations from nationally recognized researchers.
- MIDS Calculator: The Minimal Impact Design Standards (MIDS) Calculator has been updated to Version 4. The Manual contains a page summarizing updates to the calculator. The updates, with links, are summarized below.
- Constructed ponds with an iron bench
- Intensive green roofs
- Updated pollutant removals
- Bioretention media mix option
- Media amendments
- Tree rooting depth
- Tree canopy interception
- Viewing phosphorus results
- Restrictions on infiltration in D soils
- Accounting for bypass in non-infiltration and undersized BMPs
- Sand filter design levels and updated phosphorus removal
- Swale configuration and routing
- Reuse project list: Information on more than 50 reuse projects in Minnesota was added to the Manual. This includes information on source water type, end use, treatment, and more. If you know of reuse projects not included in the table and would like them included, please contact mike.trojan@state.mn.us.
What are we working on (June 2021)
- Street sweeping: We are developing guidance on street sweeping (e.g. when and where to sweep, costs, managing sweeping wastes, etc.) and that should be available in early summer. We also expect to provide information on how to incorporate sweeping into the MIDS Calculator.
- Engineered media: We continue to populate the Manual with information on engineered media, including amendments and materials in engineered media. This is a significant project and will continue through the summer. We continue to work closely with University of Minnesota researchers working on bioretention media. Most recently we have added information on wood chips and calcium-based water treatment residuals. Click on this link for more information.
- Green infrastructure: A long-term project to improve information on Green Stormwater Infrastructure in the Manual started earlier this year. We recently added some case studies and anticipate having information on O&M this summer.
- Vegetation: Another long-term project to improve information in the Manual, this work has only recently started and is in a scoping phase to identify information needs on the topic of vegetation in stormwater practices.
- Managing stormwater media waste: By this summer we expect to have information on disposal and management of engineered media used in stormwater applications, focused primarily on bioretention media.
Featured article - Pretreatment (June 2021)
The Minnesota Construction Stormwater Permit requires pretreatment for filtration and infiltration practices. Forebays or other pretreatment practices are highly recommended for constructed stormwater ponds. The permit, however, does not specify the type of or sizing for pretreatment practices. We are discovering that many stormwater best management practices (bmps, also often called stormwater control measures or scms) are not performing as designed, often due to heavy sediment loads to the bmp and to poor design.
Proper pretreatment can extend the life and improve performance of downstream bmps. But we frequently hear stories about inadequate or improperly designed pretreatment. This is unfortunate, since the Manual contains a wealth of information on pretreatment. For example, did you know the Manual contains the following?
- A pretreatment selection tool
- Tables with information and links to information on design, sizing, pollutant removal, installation, and maintenance
- Sizing guidelines
- Guidance for managing wastes from pretreatment practices
- Case studies
Below are examples of some design issues that have been brought to our attention.
- Pre-treatment baffles with shallow sumps showing up on plans (2 or 3 foot deep sumps regardless of inlet/outlet pipe size diameters and/or manhole housing diameter). Questions have been raised whether shallow sumps would function the same for large (24 inch +) inlet pipes as they would for smaller inlet pipes. Same issue goes for diameter of the structure. Much deeper sumps would seem to be required for larger inlet pipes.
- Hoods or skimmer devices are being placed over the outlet pipe with baffles, which results in a change to the flow path and likely performance of the baffle. Stormwater should flow “unimpeded” from inlet to outlet as tested in past studies. In addition to effecting the hydraulic flow, trash and floatables will build up and can negatively impact the baffle function.
- Questions specific to the use baffles with the following designs have been raised.
- Multiple inlet pipes entering a manhole with a baffle. Observations have been made where the design shows the flows short-circuit the baffle, undermining expected treatment and promoting premature bypass.
- Grated inlets which does not direct flows to one side of baffle, resulting in flows and pollutants prematurely bypassing the pretreatment device
The information in the manual could be better organized and made more accessible. So, we hope to execute a work order this summer to better organize the information on pretreatment. You can help by providing the following (NOTE: We cannot endorse or promote specific commercial products, processes, or services).
- Examples (case studies) of good and bad pretreatment practices you are finding
- Photos
- Comments and suggestions for improving information on pretreatment
Some other stuff of interest (June 2021)
- Stormwater is a major pathway for microplastics to receiving waters. Bioretention is an effective practice for retaining microplastics. ES&T Water, May, 2021.
- Stormwater Receives a ‘D’ in First-Ever ASCE Report Card Appearance - ASCE’s D+ for stormwater infrastructure results from decades of chronic underinvestment. Stormwater Report, March 2021.
- Nevada becomes the first state to formally ban “non-essential” grass. Digital Journal
- Stormwater newsletters
- On-going webinar series
- Stormwater research
